.svg)


Question:
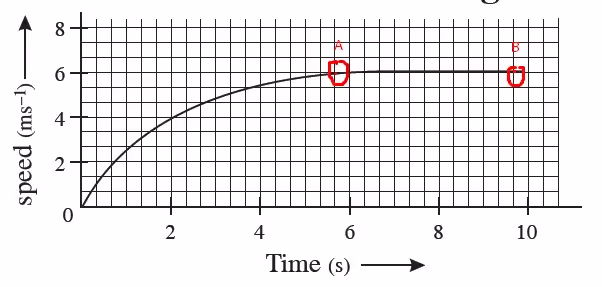
The speed time graph for a car is shown in the figure.
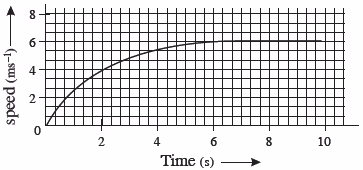
(a) Find how far does the car travel in the first 4 seconds. Shade the area on the graph that represents the distance travelled by the car during the period.
(b) Which part of the graph represents uniform motion of the car?
Answer:
(a) Distance travelled by car in the 4 second
In the given graph
56 full squares and 12 half squares come under the area slope for the time of 4 seconds.
Total number of squares = 56+(12/2)
=62 squares
On the time axis, 5 squares = 2 s.
∴ 1 square=2/5s
On the speed axis, 3 squares = 2 ms−1.
∴ 1 square=2/3 ms−1
∴ Area of 1 square = 2/5×2/3
=4/15 m
∴ Area of 62 squares = 4/15×62
=248/15
=16.53 m
Therefore, a car travels 16.53 m in the first 4 seconds.
(b) From point A to B, the graph represents uniform motion.