
.svg)


Question:
Figure shows the distance-time graph of three objects A, B and C. Study the graph and answer the following questions.
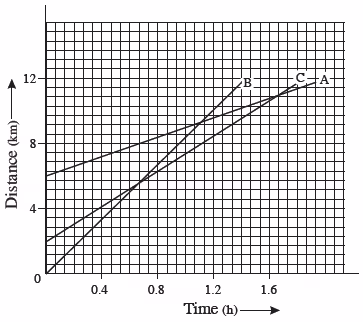
(a) Which of the three is travelling the fastest?
(b) Are all three ever at the some point on the road?
(c) How far has C travelled when B passes A?
(d) How far has B travelled by the time it passes C?
Answer:
(a) The value of velocity is greater when inclination of x-t graph from the time-axis is greater. The inclination of x-t graph of object B is the highest so B is moving at the fastest speed.
(b) All three x-t graph do not meet at any one point. Hence A, B and C will never be at the same point on the road.
(c) On the distance axis:
7 small boxes = 4 km
∴ 1 small box = 4/7 km
Initially, object C is 4 blocks away from the origin.
∴ initial distance of object C from origin = 4×(4/7)
=16/7
Distance of object C from origin when B passes A = 4/7×16
=64/7
Distance covered by C=64/7−16/7
=(64−16)/7
=48/7=6.85 km
Hence, the total distance covered by C when B passes A is 6.85 km.
(d) Distance covered by B at the time it passes C = 9 boxes
Distance travelled by B when it passes C = 4/7×9
=36/7=5.143 km
Hence, B has travelled a distance of 5.143 km when B passes C.


