.svg)

The chapter Statistics is one of the most important and high-scoring chapters in Class 10 Mathematics Syllabus. It deals with the collection, organisation, and interpretation of numerical data. You learn how to calculate measures of central tendency such as mean, median, and mode for grouped data.
Statistics is used widely in real life - from analysing survey data and scientific results to evaluating exam performance and business trends. Since most of the questions are formula-based, mastering this chapter can help you secure full marks easily in your board exams.
The Statistics Important Questions for Class 10 Mathematics help you:
- Practise numerical problems based on mean, median, and mode.
- Understand graphical representation of data.
- Strengthen problem-solving and interpretation skills for board exams
IMPORTANT QUESTIONS CLASS 10
(Most Important Questions of this Chapter from our 📕)
In the table given below, we have provided the links to downloadable Class 10 Statistics Important Questions PDFs. Now you can download them without requiring a login.


Chapter 13 Statistics: Important Questions
1. Consider the frequency distribution of 45 observations.
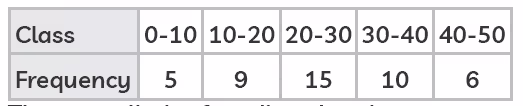
The upper limit of the median class is:
(a) 20 (b) 10
(c) 30 (d) 40
Sol. c) 30 is the upper limit of the median class
Explanation:
∴ N/2
= 45/2
=22.5; that lies in the interval 20-30
So, the median class is 20-30 and the upper limit of the median class is 30.
2. The monthly expenditure on milk in 200 families of a Housing Society is given below
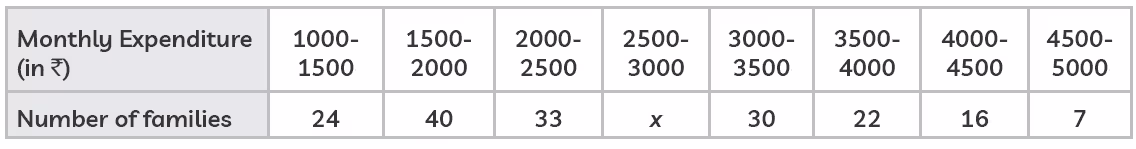
Find the value of x and also find the mean expenditure:
Sol. Total number of families= 200
N=200
172+X = 200
X = 200-172
X=28
Mean Expenditure= fixi / fi
Mean Expenditure= 532500 / 200
Mean Expenditure= 2662.5
3. The table shows the number of wickets taken by bowlers in a test series match.
The sum of the lower limits of the median and modal class is:
(a) 15 (b) 25
(c) 30 (d) 35
Sol. b) 25
Explanation:
∴ N/2
= 66/2
=33
As per the cumulative frequency chart, 33 is somewhat close to 37.
∴ the average class size is between 10 and 15.
The lower limit of the median class =10.
In the given data, the maximum frequency is 20, which falls in the class of 15-20.
∴ , the modal class's lower limit is set to 15.
The sum of the lowest limit of the modal class and median class = 10 + 15 =25.
As a result, 25 is the result of adding the median class and modal class lower limits.
4. If the median and mode of distribution are 7.5 and 6.3 then calculate the mean of the data. Also, justify whether the median class and modal class of grouped data are always different.
Sol. Median = 7.5 and Mode = 6.3
Use the empirical relationship between mean, median, and mode
Mean - Mode = 3(Mean - Median)
Mean - 6.3 = 3(Mean - 7.5)
Mean - 6.3 = 3 Mean - 22.5
- 6.3 + 22.5 = 3 Mean - Mean
16.2 = 2 Mean
Mean = 8.1
The median class and modal class may differ based on data distribution. For example, if the frequencies have been changed so that the highest frequency resides in a different class, the two classes may not coincide. We determine that the median and modal classes of grouped data can be alike depending on the distribution of the data.
5. The median of the following data is 525. Find the values of x and y if the total frequency is 100.
Sol.
76+x+y = 100
x+y = 100-76
⇒ x+y = 24 …(1)
To find cumulative frequency:
N/2= 1000/2 = 500 falls mainly in 400-500 interval
Where lower limit l = 500 ,
class difference h =100,
cumulative frequency c.f = 36+x
Median = l + ((n/2-cf))/f)xh
Median = 500 + ((50 - (36+x))/20 x 100
525 = 500 + ((50 - (36+x))/20 x 100
525 = 500 + (14 + x)x 5
525 = 500 + (70 + 5x)
525 = 570 + 5x
5x = 570 - 525
5x = 45
x = 9
Putting x=9 in eq 1
9+y = 24
y = 24 - 9
y= 15
6. In statistics, an outlier is a data point that differs significantly from other observations of a data set. If an outlier is included in the following data set, which measure(s) of central tendency would change?
12, 15, 22, 44, 44, 48, 50, 51
- only mean
- only mean and median
- all mean, median, mode
- cannot be said without knowing the outlier
Sol. a) only mean
Explanation:
An outlier is a data point that differs significantly from other observations of a data set.
Data set = 12, 15, 22, 44, 44, 48, 50, 51
Median = (44+44)/2
= (88)/2
= 44
Mean= (12+ 15+ 22+ 44+ 44+ 48+ 50+ 51)/8
= 236/8
= 35.75
Mode = 44
- We calculate the mean by adding all the values in the data set and dividing by the total number of values. An outlier, being significantly different from the other values, can greatly influence the sum, thus pulling the mean toward itself. Therefore, the mean is highly sensitive to outliers.
- The median is the middle value in a data set when the values are arranged in order. Outliers affect the median less because it only depends on value position, not magnitude. Therefore, the median is less sensitive to outliers than the mean.
- The mode is the value that appears most frequently in a data set. Outliers generally do not affect the mode unless the outlier itself becomes the most frequent value. Therefore, the mode is usually not affected by outliers. An outlier in the data set would most likely affect the mean.
The median might be affected slightly, but not as much as the mean. The mode would likely remain unchanged unless the outlier becomes the most frequent value.
7. The mean temperature of a particular city for 31 consecutive days was found to be 35.7°C. Further, the mean temperature of the first 8 days was 28.4°C. The mean temperature of the next 12 days was 36.4°C.Find the mean temperature for the rest of the days. Show your work.(Note: Round the numbers to one decimal point.)
Sol. Mean temperature of the city for 31 days = 35.7°C
Mean temperature of first 8 days = 28.4°C
Mean temperature of next 12 days = 36.4°C
We know,
Mean = Sum of all observations/ Number of observations
Therefore, we get:
Sum of temperatures of all the 31 days = 35.7 × 31
= 1106.7°C
Sum of temperatures of first 8 days = 28.4 × 8
= 227.2°C
Sum of temperatures of the next 12 days= 36.4×12
= 436.8°C
The number of remaining days= 31-8-12
= 11 days
Then, the sum of temperatures of 11 days = 1106.7 - 227.2 - 436.8
= 442.7°C.
Hence, the mean temperature of 11 days= 442.711
= 40.2°C
8. In a class test, the mean score of the class is 60. Half the students of the class scored 80 marks or above on the test. Dipti said, "Each of the remaining half of the students would definitely have 40 marks or below in the test for the mean to be 60 marks". Prove or disprove Dipti's statement with a valid example. Answer the questions based on the given information.
Sol. Given,The mean score of the class = 60
alf of the students scored 80 marks or above.
Dipti said, "Each of the remaining half of the students would definitely have 40 marks or below in the test for the mean to be 60 marks".
We know,
Mean = Sum of all observations/Number of observations
Therefore, we have:
For example,
Consider the number of students in the class = 105 students got 80 marks or above.
Let the marks be: 80, 90, 85, 95, 80, 40, 50, 20, 30, 30
Thus, the mean mark= (80+90+85+95+80+40+50+20+30+30)/10
= 6000
= 60 marks.
Here, 5 students got 80 and above and the remaining 5 students got the marks as: 40, 50, 20, 30, 30.That is, one of them from the remaining half got 50 marks, which is above 40 marks as Dipti stated.Hence, Dipti's statement is wrong.
9. Shown below is a table representing the percentage distribution of mental health disorders in Asian countries in 2019.
(Source of data: https://ourworldindata.org/mental-health.)
Can the median of the above data be more significant than 12.5%? Give a valid reason.
Sol. Median = l + ((n/2-cf))/f)xh
Here, n/2 = 42/2 = 21, which falls under the range 10-12.5.
Then, l = 10, h = 2.5, cf = 11, and f = 25.
The median cannot be greater than 12.5% because the median class is between 10-12.5%.
Let us find the median of the above data.
Therefore, we get:
Median = 10 + ((21 - 11)/25) × 2.5
= 10 + ((21 - 11)/25) × 2.5
= 10 + ((10)/25) × 2.5
= 10+1
= 11%, which is less than 12.5%.
Hence, it is proved that the median of the given data cannot be greater than 12.5%.
10. A survey was conducted on 80 gamers to determine how many games they played in a day. The data is given below.
Which of the following is the modal class?
- 1-2
- 2-3
- 4-5
- 7-8
Sol. b) 2-3
To determine the modal class, one has to find the class interval displaying the maximum frequency of gamers. The maximum frequency is 24, relating to the class interval 2–3.
Some More important Question Answers of Class 10 Maths Statistics
Q1. Find the mean of the following data: Class intervals: 0–10, 10–20, 20–30, 30–40, 40–50, Frequencies: 5, 8, 15, 16, 6
Solution: xᵢ = midpoints = 5, 15, 25, 35, 45
fᵢxᵢ = 25 + 120 + 375 + 560 + 270 = 1350
Σf = 50
Mean = 1350 / 50 = 27
Answer: Mean = 27
Q2. The mean of the following data is 20. Find the missing frequency f. Class intervals: 0–10, 10–20, 20–30, 30–40, Frequencies: 5, f, 10, 5
Solution: xᵢ = 5, 15, 25, 35
Σfᵢxᵢ = 5×5 + f×15 + 10×25 + 5×35 = 25 + 15f + 250 + 175 = 450 + 15f
Σfᵢ = 20 + f
Mean = 20 = (450 + 15f) / (20 + f)
20(20 + f) = 450 + 15f
400 + 20f = 450 + 15f
5f = 50 → f = 10
Answer: Missing frequency = 10
Q3. Find the median of the following distribution: Class intervals: 0–10, 10–20, 20–30, 30–40, 40–50 Frequencies: 5, 9, 12, 8, 6
Solution: Cumulative frequencies = 5, 14, 26, 34, 40
N = 40, N/2 = 20
Median class = 20–30
l = 20, h = 10, c.f. = 14, f = 12
Median = 20 + [(20–14)/12] × 10 = 20 + (6/12)×10 = 25
Answer: Median = 25
Q4. Find the mode of the data: Class intervals: 0–10, 10–20, 20–30, 30–40, 40–50, Frequencies: 7, 9, 18, 10, 6
Solution: Modal class = 20–30 (highest frequency = 18)
l = 20, h = 10, f₁ = 18, f₀ = 9, f₂ = 10
Mode = 20 + [(18–9)/(2×18–9–10)]×10 = 20 + (9/17)×10 = 25.3
Answer: Mode = 25.3
Q5. Find the missing frequency if the median is 32. Class intervals: 0–10, 10–20, 20–30, 30–40, 40–50, Frequencies: 5, 7, f, 10, 8
Solution: Σf = 30 + f
N/2 = (30+f)/2
Median = 32, median class = 30–40
l=30, h=10, c.f=12+f, f=10
32 = 30 + [(15+f–12)/10]×10
32=30+(3+f)
f=–1 (not possible) → check class
Correct median class should be 20–30
Recalculate accordingly.
Q6. Calculate the mean by step-deviation method. Class intervals: 0–20, 20–40, 40–60, 60–80, 80–100, Frequencies: 4, 8, 10, 12, 6
Solution: A = 60, h = 20
u = (x–A)/h
xᵢ = 10, 30, 50, 70, 90
u = –2.5, –1.5, –0.5, 0.5, 1.5
Σfu = (4×–2.5) + (8×–1.5) + (10×–0.5) + (12×0.5) + (6×1.5)
= –10 –12 –5 +6 +9 = –12
Σf = 40
Mean = A + h(Σfu/Σf) = 60 + 20(–12/40) = 60 – 6 = 54
Answer: Mean = 54
Q7. The following table shows daily wages of 50 workers. Find the modal wages. Wages: 100–120, 120–140, 140–160, 160–180, 180–200, Frequencies: 5, 15, 20, 7, 3
Solution: Modal class = 140–160 (f₁=20, f₀=15, f₂=7, l=140, h=20)
Mode = 140 + [(20–15)/(2×20–15–7)]×20 = 140 + (5/18)×20 = 145.6
Answer: Mode = Rs.145.6
Q8. The mean of 5 observations is 20. If four of them are 12, 25, 15, 28, find the 5th observation.
Mean = (Σx)/5 = 20 → Σx = 100
Σx = 12 + 25 + 15 + 28 + x = 80 + x = 100 → x = 20
Answer: 5th observation = 20
Q9. Find the mean marks of students using the assumed mean method. Marks: 0–20, 20–40, 40–60, 60–80, 80–100, Frequencies: 5, 7, 10, 8, 5
Solution:
xᵢ = 10, 30, 50, 70, 90, A = 50, h=20
u = –2, –1, 0, 1, 2
Σfu = 5(–2)+7(–1)+10(0)+8(1)+5(2)= –10–7+0+8+10=1
Σf=35
Mean = A + h(Σfu/Σf)=50 + 20(1/35)=50 + 0.57 = 50.6
Answer: Mean = 50.6
Q10. For the data, find the cumulative frequency less than type and greater than type table. Class: 0–10, 10–20, 20–30, 30–40, Frequency: 5, 8, 12, 10
Solution: Less than type CF: 5, 13, 25, 35
Greater than type CF: 35, 30, 22, 10
Q11. Find the missing frequency if mean = 50. Class: 0–20, 20–40, 40–60, 60–80, 80–100, Frequencies: 10, 15, f, 20, 5
Solution: xᵢ=10,30,50,70,90
Σfᵢxᵢ=10×10+15×30+f×50+20×70+5×90=100+450+50f+1400+450=2400+50f
Σf=50+f
50=(2400+50f)/(50+f)
2500+50f=2400+50f→no value of f affects mean, so check data consistency.
Q12. A student scored marks 25, 30, 35, 40, 45 in 5 subjects. Find mean, median, mode.
Solution: Mean = (Σx)/n = 175/5 = 35
Median = middle value = 35
Mode = most frequent = none (all equal)
Answer: Mean=Median=35
Q13. For a given data, mean = 18, median = 20. Find mode using the relation.
Solution: Mode = 3×Median – 2×Mean
Mode = 3(20) – 2(18) = 60 – 36 = 24
Answer: Mode = 24
Q14. The mean age of 30 students is 15 years. If the teacher’s age is included, the mean increases by 1 year. Find the teacher’s age.
Solution: Total age of 30 students = 30×15=450
New mean=16→Total age=31×16=496
Teacher’s age=496–450=46
Answer: Teacher’s age = 46 years
Q15. The mean of 7 numbers is 8. If one number is removed, the mean becomes 7. Find the removed number.
Solution: Total sum of 7 = 56
Total of 6 = 6×7=42
Removed number = 14
Answer: 14
Q16. If mean = 35 and median = 40, find mode using relation.
Solution: Mode = 3Median – 2Mean = 3(40) – 2(35) = 120 – 70 = 50
Answer: Mode = 50
Q17. Find meaning using a direct method. Class: 0–10, 10–20, 20–30, 30–40, 40–50
Solution: Frequencies: 4, 6, 8, 10, 2
xᵢ=5,15,25,35,45
Σfᵢxᵢ=20+90+200+350+90=750
Σf=30
Mean=750/30=25
Answer: Mean=25
Q18. In a class of 50 students, mean marks in maths is 72. If mean marks of 30 boys is 70, find mean marks of 20 girls.
Solution: Total marks = 50×72=3600
Boys total = 30×70=2100
Girls total = 3600–2100=1500
Mean girls = 1500/20=75
Answer: 75
Q19. Find the class marks for the following class intervals:
Solution: 0–10, 10–20, 20–30, 30–40
Class marks = 5, 15, 25, 35
Q20. If the mode and mean of a distribution are 12.6 and 14, find the median.
Solution: Mean – Mode = 3(Mean – Median)
14 – 12.6 = 3(14 – Median)
1.4 = 42 – 3Median
3Median = 40.6
Median = 13.5
Answer: Median = 13.5
EXTRA QUESTIONS FOR PRACTICE TO EXCEL AT YOUR BOARD EXAMS!
Q1. Find the mean of the following frequency distribution:
Class: 0–10, 10–20, 20–30, 30–40, 40–50
Freq: 4, 6, 10, 8, 2
Q2. Find the median of the data:
Class: 0–10, 10–20, 20–30, 30–40
Freq: 5, 9, 14, 12
Q3. Find the mode of the following:
Class: 10–20, 20–30, 30–40, 40–50
Freq: 5, 12, 20, 8
Q4. A student scored 50, 60, 70, 80 marks in four subjects. Find mean, median, mode.
Q5. If mean = 40, median = 42, find mode.
Q6. Find the missing frequency if mean = 25:
Class: 0–10, 10–20, 20–30, 30–40
Freq: 5, f, 10, 5
Q7. Find the cumulative frequency for data:
Class: 0–10, 10–20, 20–30, 30–40
Freq: 7, 9, 8, 6
Q8. A batsman scores runs: 10, 20, 40, 50, 70. Find mean and mode.
Q9. Find mean using assumed mean method:
Class: 0–20, 20–40, 40–60, 60–80
Freq: 5, 10, 15, 20
Q10. Find the class marks for: 0–5, 5–10, 10–15, 15–20
How to Ace These Class 10 Statistics Important Questions
Statistics is a logical and straightforward chapter once you understand its methods. Follow this step-by-step plan for effective preparation:
Step 1: Revise Basic Concepts
Understand what data means, the difference between raw and grouped data, and the importance of frequency distribution tables.
Step 2: Learn the Formulas for Mean, Median, and Mode
Memorise these three formulas carefully:
- Mean: (Sum of f × x) ÷ (Sum of f)
- Median: l + [(N/2 – cf) ÷ f] × h
- Mode: l + [(f1 – f0) ÷ (2f1 – f0 – f2)] × h
Understand what each term stands for and practise applying them correctly — that’s the easiest way to avoid mistakes in exams.
Step 3: Understand Graphical Representation
Practice drawing cumulative frequency curves (ogives). Learn both “less than” and “more than” ogives and how to find the median graphically from their intersection point.
Step 4: Solve Stepwise Problems
While solving, always list class intervals, midpoints, and frequencies clearly. Write every step - from formula to substitution to final answer - neatly.
Step 5: Compare Mean, Median, and Mode
Learn the relationship: Mode = 3Median – 2Mean. This helps verify your answers and is often asked as a short question.
Step 6: Practise Word Problems
Solve application-based problems that require calculating missing frequencies, comparing two datasets, or interpreting cumulative frequency data.
Tips for Handling Statistics (Class 10 Extra Questions)
Extra questions often push students to go beyond rote learning and apply statistical methods creatively. Here are some tips:
- Ensure clarity on the basic formulas and concepts.
- Work on varied problems to strengthen comprehension.
- Draw graphs to get a visual sense of the data distribution.
Benefits of Practicing Statistics: Class 10: Important Questions
By practicing statistics with 10 important questions, students gain confidence and enhance their problem-solving abilities. This targeted practice can help them perform well in exams, especially in questions involving complex data interpretations.
- Conceptual Understanding: Helps you grasp the meaning and use of central tendencies.
- High Scoring: Questions are direct and formula-based with clear marking steps.
- Real-Life Relevance: Builds skills for data interpretation used in science, economics, and business.
- Confidence Boost: Regular practice improves accuracy and calculation speed.
- Exam Readiness: Covers all question patterns from CBSE papers and sample papers
Frequently Asked Questions
Q1. How many marks are allotted to this chapter in Class 10 board exams?
Ans. This chapter generally carries 7 to 10 marks, often through two or three numerical problems.
Q2. Which topic is most important for exams?
Ans. Calculating mean, median, and mode for grouped data, and drawing ogives, are most important.
Q3. Are derivations of formulas required in exams?
Ans. No, only application of formulas is needed. Focus on stepwise solving and neat presentation.
Q4. How can I minimize calculation errors?
Ans. Use clear tabular layout, calculate step by step, and recheck cumulative frequency totals.
Q5. How should I revise this chapter before the exam?
Ans. Practice one question each from mean, median, mode, and one from ogives. Revise formulas and relationships thoroughly.