
.svg)


Question:
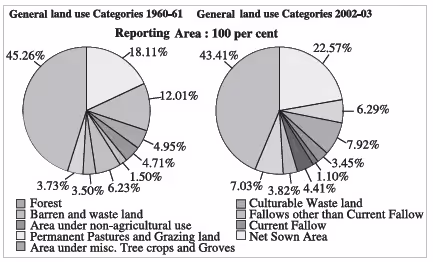
Try to do a comparison between the two pie charts given for land use and find out why the net sown area and the land under forests have changed from 1960- 61 to 2002-03 very marginally.
Answer:
The net sown area and the land under forests have changed from 1960-61 to 2002-03 very marginally because of the following factors:
- Urbanization
- floods
- Increasing population,
- Fragmentation of land holdings
- Declining water table
- Unabated and massive conversion of agricultural land for building houses and construction of infrastructure.
- Rise in cost of irrigation

More NCERT Questions
Download Free PDF
(All Q's of this Chapter solved)


