
.svg)


Question:
Graph 3.3: Share of people living on $1.90 a day, 2005-2019
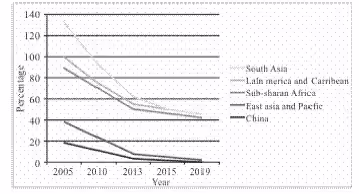
Source: Poverty and Equity Database, Work Bank (http://databank.worldbank.org/data/reports.aspx?sourcepoverty-and-equity-database)
Graph 3.4: Number of poor by region ($ 1.90 per day) im millions
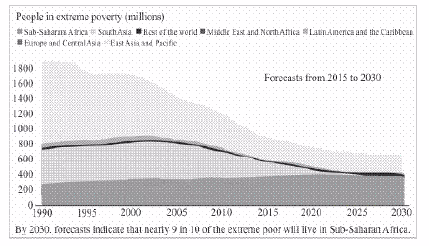
Source: World Bank PovcalNet and Poverty & Equity Data Portal (http://databank.worldbank.org/data/reports.aspx?sourcepoverty-and-equity-database)
Study the Graph 3.4 and do the following:
i. Identify the areas of the world, where poverty ratios have declined.
ii. Identify the area of the globe which has the largest concentration of the poor.
Answer:
(i)The areas of the world where poverty ratios have declined are
(a) South Asia (b) East Asia and Pacific (c) China
(ii) South Asia is the area of the globe which has the largest concentration of the poor.


