
.svg)
Science becomes more meaningful when concepts are explored through experiments, and CBSE continues to promote practical learning alongside theory for the 2026-27 session. The Class 10 Science Practical File is an important part of this approach, helping students understand concepts through real-life applications and hands-on activities in an engaging way.
Science Lab Manual Class 10 PDF Free Download
The Class 10 Science Lab Manual for 2026-27 includes experiment focused on important topics like light reflection, chemical reactions, and properties of substances, helping students strengthen their observation, analytical, and problem-solving skills through practical learning.
CBSE Class 10 Activities
Below students can find the unit-wise Class 10 Science Practical Book PDF activities with solutions.


Chapter 1: Chemical Reactions and Equations
1. To study the chemical reaction of an iron nail with aqueous copper sulphate solution; and to study the burning of magnesium ribbon in air.
a. The chemical reaction of iron nails with copper sulphate solution in water.
Aim
To study the chemical reaction of an iron nail with aqueous copper sulphate solution
Theory
Iron displaces copper ions from an aqueous solution of copper sulphate. It is a single displacement reaction of one metal by another metal. Iron is placed above copper in the activity series. Elements placed above in this series are more reactive than those placed below them. Thus iron is more reactive than copper. In this reaction, metallic iron is converted into ferrous ions (Fe2+) and cupric ions (Cu2 +) are converted into metallic copper.
Fe (s) + Cu2 + (aq) → Fe2+ (aq) + Cu (s)
Materials Required
Two test tubes, two iron nails, measuring cylinder (50 mL), laboratory stand with clamp, test tube stand, thread, a piece of sandpaper, single bored cork, copper sulphate, distilled water, and dil. sulphuric acid.
Procedure
- Take two iron nails and clean them with sandpaper.
- Take 20 mL of distilled water in a clean test tube and dissolve 1.0 g of copper sulphate in it. Add 2 or 3 drops of dil. sulphuric acid to it to check the hydrolysis of CuSO4 in water. Label this test tube as A.
- Transfer about 10 mL of copper sulphate solution from tube A to another clean test tube. Label this test tube as B.
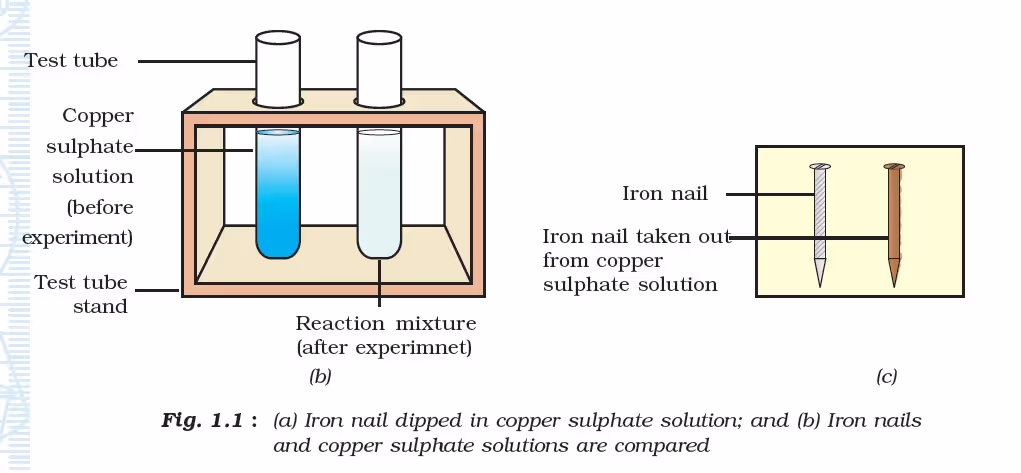
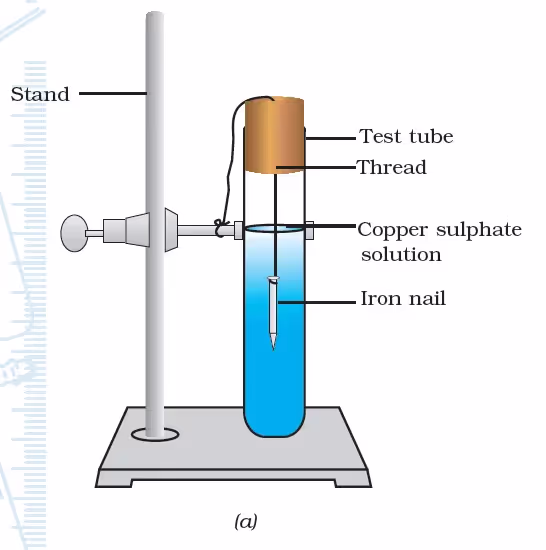
- Tie one iron nail with a thread and immerse it carefully in copper sulphate solution in test tube B through a bored cork [as shown in Fig 1.1(a)] for about 15 minutes [Fig. 1.1(a)]. Keep the other iron nails separately for comparison afterwards.
- After 15 minutes take out the iron nail from the copper sulphate solution.
- Compare the intensity of the blue colour of copper sulphate solution before and after the experiment in tubes A and B, and also compare the colour of iron nails dipped in copper sulphate solution with the one kept separately [Fig. 1.1(b) and (c)]. Record your observations.
Observations
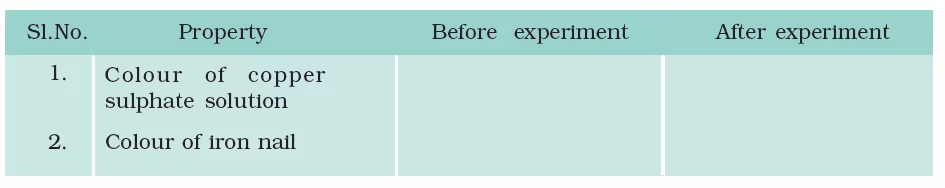
Results and Discussion
Infer from your observations about the changes in colours of copper sulphate solution and iron nail. Discuss the reason(s).
Precautions
- The iron nails must be cleaned properly by using sandpaper before dipping them in copper sulphate solution.
Questions
- Why does the colour of copper sulphate solution change, when an iron nail is dipped in it?
- How would you devise the procedure to show that Mg > Fe > Cu in reactivity series?
- What is the basic principle involved in this experiment?
- Why does the following reaction take place?

b. The chemical reaction of the burning of magnesium ribbon in air.
Aim
To study the burning of magnesium ribbon in the air.
Theory
Magnesium forms magnesium oxide on burning in the presence of air. It is a combination reaction between two elements. Magnesium oxide is basic and thus its aqueous solution turns red litmus blue.
2Mg (s) + O2 (g) → 2MgO (s)
Materials Required
Magnesium ribbon (2 to 3 cm long), a pair of tongs, a burner, a pair of dark-coloured goggles, a watch glass, red and blue litmus papers, distilled water, a beaker, and a piece of sandpaper.
Procedure
- Take a magnesium ribbon (2 to 3 cm long) and clean it with sandpaper. This will remove the oxide layer deposited over the magnesium ribbon, which makes it passive.
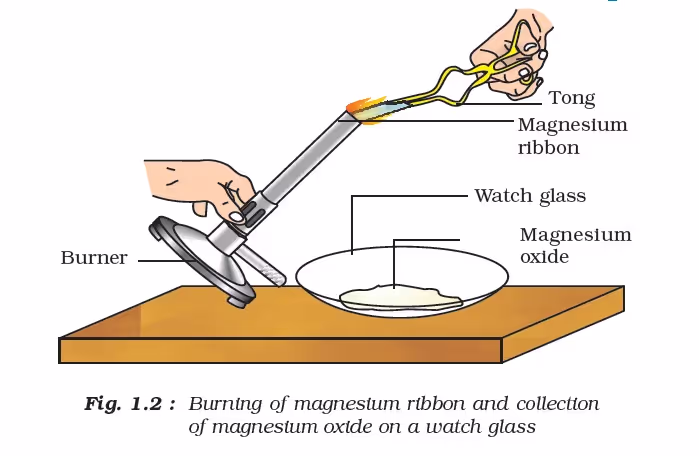
- Hold the magnesium ribbon with a pair of tongs over a watch glass and burn it in the air with a burner (Fig. 1.2). Watch the burning of the magnesium ribbon using a pair of dark-coloured goggles.
- Collect the white powder obtained on a watch glass.
- Transfer and mix the white powder in a beaker containing a small amount of distilled water.
- Put drops of this mixture over the red and blue litmus papers and record your observations.
Observations
- On putting a drop of the mixture over the red litmus paper, the colour of the red litmus paper changes into _____.
- On putting a drop of mixture over the blue litmus paper, the colour of the blue litmus paper changes into _____.
Results and Discussion
The change in the colour of ____ litmus paper into _____ suggests that the aqueous solution of magnesium oxide is ________ in nature.
Precautions
- Clean the magnesium ribbon carefully to remove the deposited oxide layer on it.
- Burn the magnesium ribbon keeping it away from your eyes as far as possible and use dark-coloured goggles to see the dazzling light emitted during the burning of magnesium. (Why?)
- Collect magnesium oxide powder carefully so that it does not touch your skin.
Note for the Teacher
- Oxides on account of their interacting capability with water are classified as acidic, basic and neutral oxides.
- Magnesium oxide (MgO) dissolves in water to form magnesium hydroxide Mg(OH)2 (aq) which is a strong base.
MgO (s) + H2O (l) → Mg (OH)2 (aq)
Here the reaction is:
O2– (s) + H2O (l) → 2OH– (aq).
- It is advised to tilt the burner to collect the magnesium oxide (product).
Questions
- Why should magnesium ribbon be cleaned before burning it in the air?
- Which reaction takes place when magnesium burns in the air? Why is it called a combination reaction?
- Why does the red litmus paper turn blue when touched with an aqueous solution of magnesium oxide?
- Why is it suggested to wear dark-coloured goggles while watching the burning of magnesium ribbon in the air?
Chapter 2: Acids, Bases, and Salts
2. To show that Acids, bases and Salts are electrolytes.
Aim
To show that acids, bases, and salts are electrolytes.
Theory:
An electrolyte is a compound that, in solution or in the molten state, conducts an electric current and is simultaneously decomposed by it. The current in electrolytes is carried by the ions and not by the electrons as in metals. Electrolytes may be acid, bases, or salts. In this experiment we shall observe it by means of continuity test in an electric circuit that contains either an acid or a base or a salt solution as a part of it.
Materials Required:
Hydrochloric acid (about 5 mL), sodium hydroxide flakes (about 100 mg), sodium chloride (about 5 g), distilled water, four beakers (250 mL), four dry cells of 1.5 V each with a cell holder (or a battery of 6 V or a battery eliminator), a torch bulb of 6 V with a torch bulb holder, a rubber cork, two iron nails, a plug key, connecting wires, and a piece of sandpaper.
Procedure:
- Using a sandpaper, clean the insulation layers from the ends of connecting wires.
- Take a dry rubber cork and fix two iron nails in it at a distance. The two nails will work as two electrodes. Also connect these two nails, separately, with connecting wires.
- Draw a circuit diagram for performing a continuity test in an electric circuit that contains either an acid or a base or a salt solution as a part of it (see Fig. 6.1). Observe how different components like the dry cells (or battery or battery eliminator), torch bulb, a plug key, and the solution are connected in the circuit.
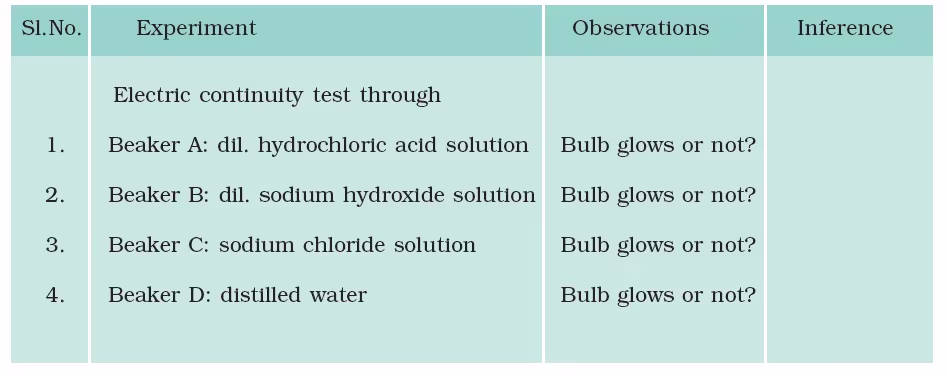
- Take nearly 100 mL distilled water in each of the four beakers (250 mL). Label them as beakers A, B, C, and D respectively.
- Add about five drops of hydrochloric acid in distilled water in beaker A to get an acidic solution; add about 100 mg flakes of sodium hydroxide in beaker B to get a basic solution; and add about 2 - 3 g of sodium chloride salt (about half a teaspoon) in water in beaker C to get a sodium chloride salt solution. Do not add anything in the distilled water in beaker D.
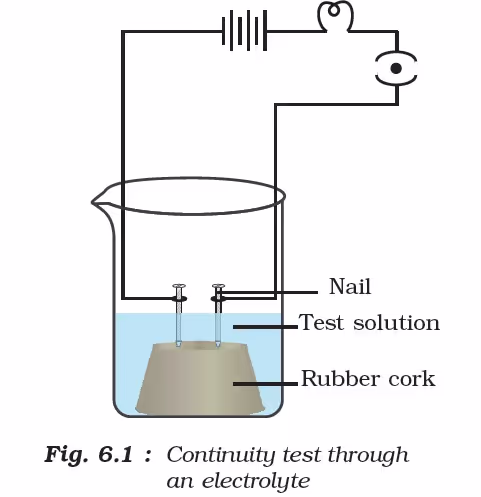
6. Set up the electric circuit by connecting different components with the help of connecting wires. Do not dip the rubber cork (in which two iron nails are fixed and connected in the circuit) in any beaker. Insert the key into the plug. Check whether the torch bulb glows. It does not. Does it mean that the electric circuit is yet not complete or the dry rubber cork does not conduct electricity? Remove the key from the plug.
7. For observing the continuity test through the dil. hydrochloric acid (say), place the rubber cork in the beaker A such that the two iron nails are partially dipped in the solution.
8. Insert the key in the plug and allow the current to flow in the circuit containing dil. hydrochloric acid solution as a component. Does the bulb glow now? Yes, it glows. It means that the electric circuit is now complete and that the hydrochloric acid conducts electricity. Thus it is an electrolyte. Record your observation.
9. Remove the key and take out the rubber cork from the beaker A. Wash the rubber cork and make it dry using a clean cloth.
10. Repeat the experiment for the continuity test through the dil. Sodium hydroxide solution, sodium chloride solution, and distilled water by successively dipping the rubber cork in beakers B, C, and D respectively.
Observations:
Results and Discussions:
Infer from the observations that acids, bases and salts are electrolytes.
Discuss the following dissociation reactions:
HCl (aq) → H+ (aq) + Cl–(aq)
NaOH (aq) → Na+ (aq)+OH– (aq)
NaCl (aq) → Na+ (aq) + Cl– (aq).
Precautions:
- The ends of the connecting wires must be cleaned and connected tightly with the other components of the circuit.
- The acidic concentration in the distilled water must be highly dilute otherwise the nails will start reacting with the acid.
- The nails must be partially dipped inside the liquid while performing electric continuity test.
- The rubber cork must be washed and dried after every test and before dipping it in another liquid solution
Note for the teachers:
- In place of four cells of 1.5 V each, a 6 V battery or a battery eliminator may also be used. Please make sure that if a 6 V source is used in the circuit, a torch bulb of 6 V must be used. This experiment can also be performed with 3 V source preferably with a 3 V torch bulb.
- In place of a torch bulb, a galvanometer or an ammeter (0 - 3 A) may also be used to perform the continuity test. Please also connect a resistor of about 1 or 2 W resistance in series with the galvanometer or ammeter.
- Experiment Nos. 48 to 51, involve observations with electric circuits. It is advised that students may be suggested to perform any of these experiments before performing this experiment.
- In place of hydrochloric acid solution, sulphuric acid solution may also be used.
Questions
- Though sodium chloride and potassium chloride crystals are composed of ions. Why do they not conduct electricity?
- How does an alcoholic solution of potassium hydroxide conduct electricity?
- How does the hydrochloric acid solution prove to be a better conductor of electricity than the acetic acid solution (CH3COOH)?
- Which substance is used as an electrolyte in lead storage batteries and which one in dry cells?
- What are the current carriers in electrolytes?
Chapter 3: Metals and Non-metals
3. To study the interaction of metals such as magnesium, zinc, iron, tin, lead, copper, and aluminium (any four) with their salt solutions and to arrange them according to their reactivity.
Aim
To study the interaction of metals such as magnesium, zinc, iron, tin, lead, copper, aluminium (any four) with their salt solutions and to arrange them according to their reactivity.
Theory
Different metals have different reactivities towards chemical reagents. Some metals are more reactive than others. The metals, which can lose electrons more readily to form positive ions are more reactive. Displacement reactions can be used to find out the relative reactivities of metals. A more reactive metal displaces a less reactive metal from its salt solution. For example, if a piece of zinc metal is dipped in a solution of copper sulphate, zinc will displace copper from copper sulphate. The blue colour of copper sulphate solution will gradually fade and finally, a colourless solution of zinc sulphate will be obtained.
Zn (s) + CuSO4 (aq) → ZnSO4 (aq) + Cu (s)
Blue Colourless Reddish brown
Materials Required
Pieces of metals such as zinc, copper, iron, and lead or other suitable metals (at least four strips of each metal), solutions like zinc sulphate; copper (II) sulphate; iron (II) sulphate; and lead nitrate, distilled water, four beakers (100 mL), four test tubes, a measuring cylinder (50 mL), sa test tube stand, and a piece of sandpaper.
Procedure
- Take zinc, copper, iron, and lead metal pieces and clean their surfaces with a sand paper.
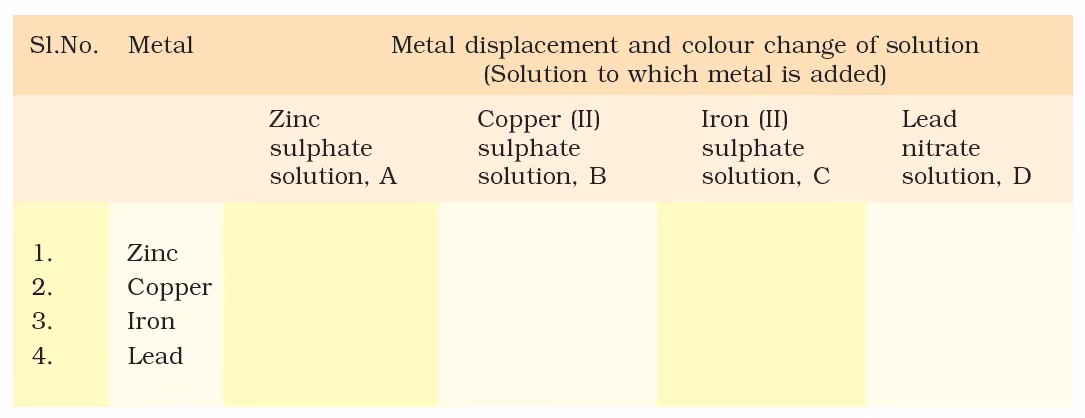
- Prepare 50 mL solutions of 5% concentration (by volume) of zinc sulphate, copper (II) sulphate, iron (II) sulphate and lead nitrate in distilled in four different beakers. Label these beakers as W, X, Y, and Z. Note that these are the salt solutions of the four metals taken for studying the interaction.
- Take 10 mL of each solution in four different test tubes and label them as tubes A, B, C, and D.
- Put zinc metal strip in all the four test tubes, that is in tubes A, B, C, and D and observe the change that follows.
- Repeat the above experiment with other metal strips by dipping them in fresh salt solutions of metals and observing for displacement reactions.

Observation:
Results And Discussion
Infer from the observations and arrange the metals in the order of their decreasing reactivities.
Precautions
Clean the metals by rubbing them with a piece of sandpaper before dipping them in the salt solutions.
Wash the test tubes after every set of observations of the interaction of a particular metal with the four salt solutions.
Note for the Teacher
One or two drops of conc. H2SO4 may be added during the preparation of salt solutions to avoid the hydrolysis of sulphate salts.
For obtaining granuels of different metals, sheets of metals may be cut into smaller pieces.
Questions
- Why did the colour of copper (II) sulphate solution change, when zinc metal was dipped in it?
- What is your observation when copper is added in iron (II) sulphate solution?
- Which is the most and the least reactive metal in the above experiment?
- Why can we safely preserve iron (II) sulphate in a copper vessel whereas the same can’t be safely preserved in a zinc vessel?
Chapter 4: Carbon Compounds
4. To study the physical and chemical properties of acetic acid (ethanoic acid).
Aim
To study the physical and chemical properties of acetic acid (ethanoic acid).
Theory
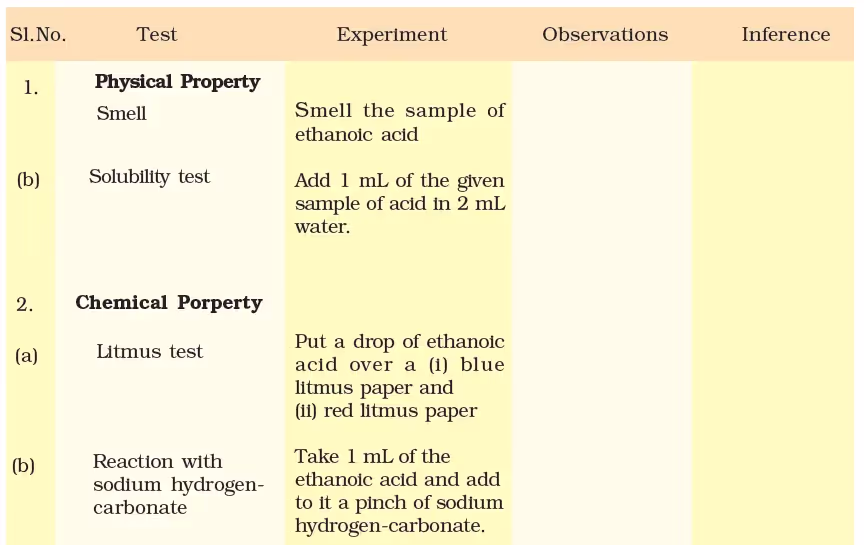
Ethanoic acid (CH3COOH) is an organic acid containing (-COOH) functional group. It has an odour of vinegar. It turns blue litmus paper red and reacts with
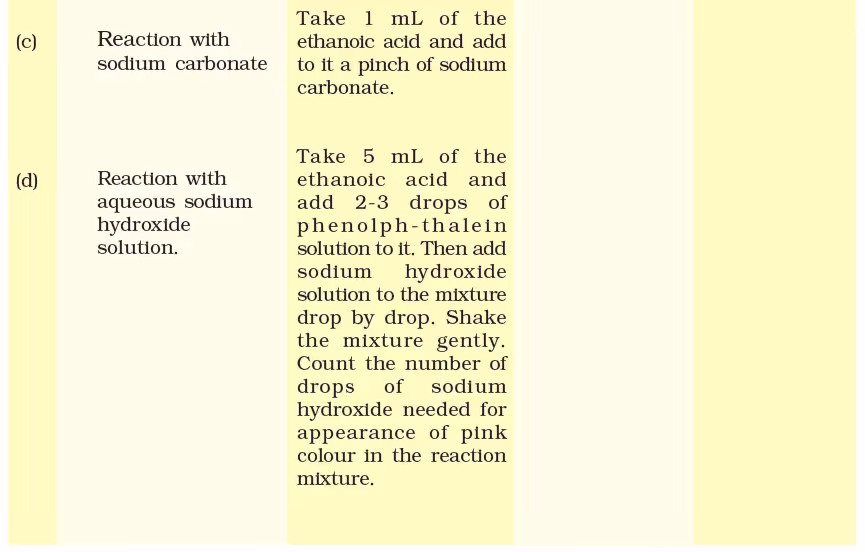
(a) sodium hydrogencarbonate and sodium carbonate to evolve carbon dioxide gas.
CH3COOH (l) + NaHCO3 (s) → CH3COONa (aq) + CO2 (g) + H2O (l)
2CH3COOH (l) + Na2CO3 (s) → 2CH3COONa (aq) + CO2 (g) + H2O (l)
(b) sodium hydroxide to produce sodium ethanoate and water.
CH3COOH + NaOH (aq) → CH3COONa (aq) + H2O.
Materials Required
Sodium hydrogencarbonate, sodium carbonate, sodium hydroxide, phenolphthalein solution, conc. sulphuric acid, 5% ethanoic acid, blue litmus paper strips, two beakers (100 ml), four test tubes, measuring cylinder (10 mL), tripod stand, a burner, and wire gauge.
Procedure
Study the physical and chemical properties of ethanoic acid according to the following table and record your observations.
Observations:
Results and Discussion
Infer the physical properties and chemical properties on the basis of observations.
Precautions
- Handle ethanoic acid carefully.
- Add only a small amount (0.01 g) of NaHCO3 or Na2CO3 to ethanoic acid to control the intensity of CO2 evolved.
Questions
- Which gas evolves when ethanoic acid reacts with sodium hydrogencarbonate?
- How will you test that the liberated gas is carbon dioxide?
- Where do you find the use of ethanoic acid in day-to-day food products?
- What is the common name of ethanoic acid as sold in the market in the form of its dilute solution?
- What type of reaction takes place between ethanoic acid and sodium hydroxide solution?
Chapter 5: Life Processes
5. To prepare temporary mounts of leaf peels to observe stomata and to differentiate between dicot and monocot stomata.
Aim
To prepare temporary mounts of leaf peels to observe stomata and to differentiate between dicot and monocot stomata.
Theory
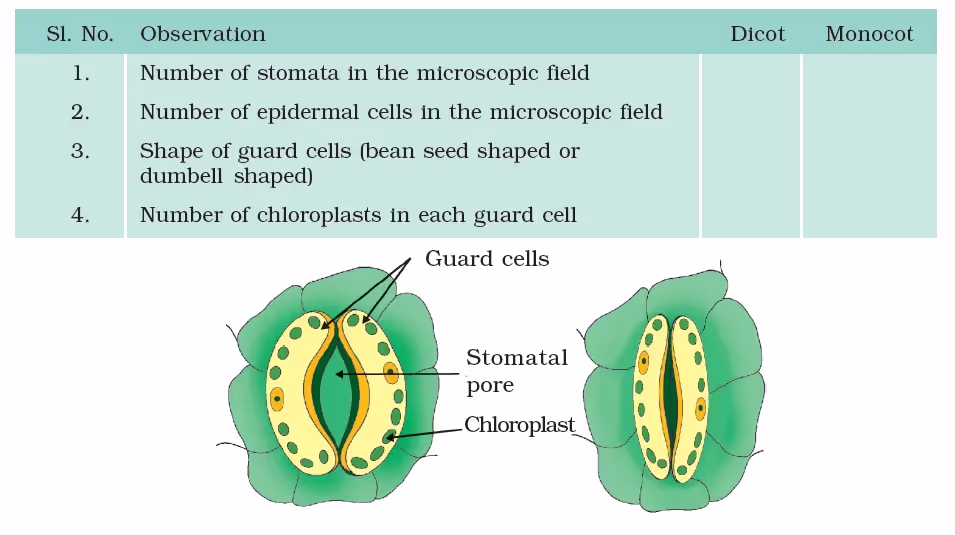
In plants, physiological processes such as respiration and photosynthesis involve exchange of gases between plant tissues and the external atmosphere. This occurs through minute microscopic pores called stomata (singular; stoma) present in the leaf. Stoma is an elliptical pore with two kidney-shaped guard cells on either side. The guard cells have thin outer and thick inner walls. When guard cells are turgid, the stoma opens and it closes when the guard cells are flaccid. The number, distribution and type of stomata varies in different plants. Within a plant, the number and distribution may vary between the upper and lower surfaces of leaf. However, the type of stomata remains the same in a particular plant species. Stomata are either absent or non-functional in submerged aquatic plants. In this experiment we shall prepare the temporary mounts of leaf peels of dicot and monocot plants to observe their stomata.
Materials Required
Fresh leaves of a dicot plant (such as Petunia, Dianthus, Solanum) and a monocot plant (such as lily, maize, grass), compound microscope, slide, cover slip, needle, brush, a piece of blotting paper, and a razor blade.
Procedure
- Remove a peel from the lower surface of a dicot leaf. This can be easily done by folding or tearing the leaf and pulling out the thin membranous transparent peel. Leaf peels can also be obtained by carefully scratching the leaf surface with a razor blade.
- Mount the peel on a slide in a drop of water and place a cover slip on it. Avoid air bubbles. Blot the excess water from the slide. Focus the peel under the low power of a compound microscope and observe the stomata, guard cells and epidermal cells.
- Count the number of stomata, and epidermal cells in the field of microscope without disturbing the slide.
- Observe and identify the contents of guard cells under high power.
- Move the slide and again count the number of stomata and epidermal cells. Record your observations.
- Calculate the average number of stomata and epidermal cells in the field of the microscope.
- Draw the diagram of a stoma and label its parts.
- Repeat the process with peels removed from a monocot leaf. Record your observations.
- Following the same procedure, study the stomata of other dicot and monocot plants.
Observations:
Results and Discussion
Based on the observation compare the characteristics of the dicot and monocot stomata and draw your own conclusion.
Note for the Teacher
It is found that the number, size, and distribution of stomata vary in different plants. In general, the stomata are lesser on the upper surface as compared to that on the lower surface of the leaf.
Fewer stomata on the upper surface prevent excessive loss of water due to transpiration as this surface is directly exposed to sunlight
In aquatic plants stomata are either absent or non-functional. Stomata are absent in roots also.
This experiment can be extended as a project by taking the leaves of different plants. This will help students to have a fair idea about the variations in shape, number, size and distribution of stomata on two surfaces of leaves of different plants.
The stomatal index can be calculated by using the formula
Stomatal index = ×100% S E .
Here S and E are the numbers of stomata and epidermal cells respectively per microscopic field.
Questions
- Why is the number of stomata greater on the lower surface of a leaf?
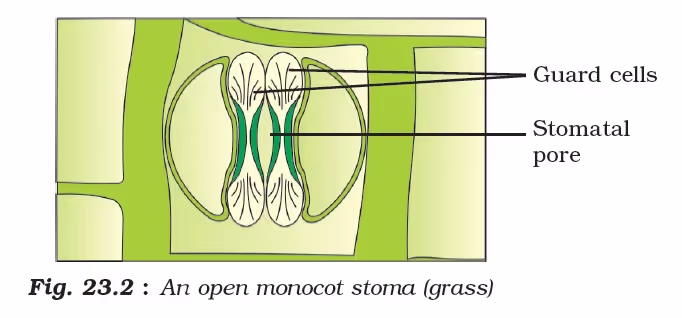
- What is the shape of guard cells in the stoma of grass leaves?
- Do guard cells have rigid or elastic walls? Justify your answer.
Chapter 6: Control and Coordination
6. To determine the mass percentage of water imbibed by raisins.
Aim
To determine the mass percentage of water imbibed by raisins.
Theory
Imbibition is a special type of diffusion in which the movement of water takes place due to differences in water molecule concentration between the adsorbent and the imbibant. For imbibition to occur, an adsorbent is required. For example, the dry plant or dry seeds (adsorbent) when placed in water increase enormously in volume. The water molecule concentration difference between the adsorbent and the liquid imbibed is essential for imbibition. In addition, for any adsorbent to imbibe any liquid, affinity between the adsorbent and the imbibent is necessary. For example, the cellulose material of dry wood (adsorbent) has a strong affinity for water (imbibent). This results in swelling of wood when kept in water. The rate of imbibition varies with the temperature variations. In this experiment, we shall study the phenomenon of imbibition using dry raisins. Water molecules enter the dry raisins, as a result of which they swell. The difference in mass between swollen and dry raisins gives the amount of water absorbed by the raisins. When expressed in terms of percentage, it is called the mass percentage of water imbibed by raisins.
Mass % of water imbibed = (mass of the water absorbed by the raisins / initial mass of the raisins) x 100
Materials Required
A handful of raisins, a beaker (50 mL), a thermometer, a physical balance with weight box, a pair of forceps and a piece of blotting paper.
Procedure
- Select about twenty dry and clean raisins of approximately uniform size.
- Weigh them using a physical balance and note their mass (m1 ).
- Keep the raisins for about an hour in sufficient water taken in a beaker. (It is expected that the raisins will be completely swollen within an hour.)

- Note the temperature (θ )of water in the beaker.
- Using forceps, remove the swollen raisins from the beaker; gently roll them on a blotting paper to remove the water sticking to their surface.
- Weigh the swollen raisins to find their final mass (m2 ).
Observations and Calculations
Temperature of water, θ = ______ °C = ______ K
The initial mass of the twenty dry raisins, m1 = ______ g
The final mass of the swollen raisins, m2 = ______ g
Mass of the water absorbed by the raisins, (m2 - m1 ) = ______ g.
Or
Mass % of water imbibed = (mass of the water absorbed by the raisins / initial mass of the raisins) x 100
Mass % of water imbibed = ((m2 - m1 )/m1) x 100
Results And Discussion
The mass percent of water absorbed by the raisins at temperature ____ K is ____ %. Analyse the reasons for water imbibed by the raisins.
Precautions
- Ensure that the raisins are dipped in water completely.
- Remove the raisins from the beaker only after ensuring that the raisins are completely swollen. Care should be taken while taking the raisins out from the beaker while using forceps. The forceps must not pierce into the raisins.
- Before weighing the swollen raisins, they should be properly dried with the help of blotting paper.
Note for the Teacher
- In this study, adsorption is the process of formation of a layer of a liquid on a solid.
- In place of raisins, dry gram seeds may also be used. However, these may require more time for complete swelling.
- The mechanism by which the water enters the raisins or seeds is also called imbibition.
Questions
- Will a piece of iron also swell when it is kept in water? Justify your answer.
- Have you experienced difficulty in closing wooden doors or windows during rainy seasons? Give a suitable explanation.
- Suggest an experiment by which the swollen raisins can be shrunk again.
- What is the effect of temperature on the rate of imbibition?
7. To study binary fission in Amoeba or Paramoecium and budding in yeast or Hydra.
Aim
To study binary fission in Amoeba or Paramoecium and budding in yeast or Hydra.
Theory
Binary fission and budding are forms of asexual reproduction in lower organisms, like bacteria, unicellular protozoans, and a few other animals. In binary fission, the parent cell divides into two daughter cells by amitosis and each daughter cell grows into an adult. The division of the nucleus is called amitosis because the stages of a typical mitotic division are not observed in these cells. Budding is commonly seen in yeast and Hydra. Hydra is a tiny freshwater organism which produces young ones from its body laterally. Yeast is a unicellular organism which produces a chain of cells attached to the parent cell.
Materials Required
A compound microscope, permanent slides of binary fission in Amoeba or Paramoecium; budding in yeast or Hydra; charts of binary fission and budding.
Procedure
- Focus the slide under high power of compound microscope.
- Observe the stages in binary fission and budding (Figs. 31.1 and 31.2).
- Draw diagrams of the stages in binary fission and budding.

Note for the Teacher
- Charts may be used to reinforce the knowledge about different stages in binary fission and budding.
- A few points pertaining to binary fission and budding are given as follows:
(a) Binary fission in Amoeba or Paramoecium
(i) Amoeba is irregular in outline and possesses a nucleus.
(ii) Paramoecium is also a unicellular organism but its shape is like a slipper.
(iii) While viewing the permanent slide under high power, it is advised to locate and demonstrate the stages of binary fission.
(b) Budding in yeast or Hydra
(i) Yeast cells are spherical or oval in shape.
(ii) While viewing the permanent slide under high power, it is advised to locate and demonstrate the stages of budding and chain of buds.
(iii) In Hydra, buds appear laterally from the parent organism.
Questions
- Which type of cell division is involved in binary fission?
- How many daughter cells are formed in binary fission?
- Why binary fission and budding are included under asexual reproduction?
- Are binary fission and budding faster processes of reproduction when compared to sexual reproduction? Justify.
Chapter 9: Light Reflection and Refraction
9. To verify the laws of reflection of light using a plane mirror.
Aim
To verify the laws of reflection of light using a plane mirror.
Theory
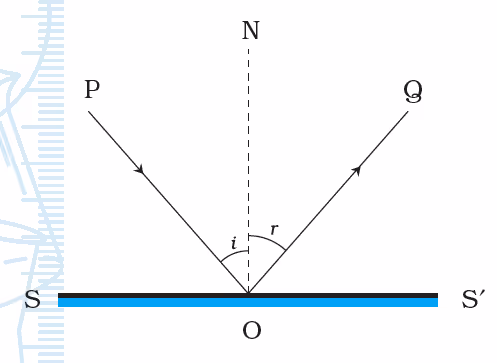
When light falls on a smooth polished surface, it gets reflected in a definite direction. Fig. 34.1 shows a ray of light PO, incident on a plane polished surface (plane mirror) SS’. Line OQ shows the changed path of the incident ray after reflection at point O. The ray PO is called incident ray and ray OQ is called reflected ray. The point O where the incident ray strikes the polished surface is called point of incidence. If ON is the normal to the polished surface SS′ at point O, then the angle PON and the angle NOQ are called the angle of incidence (i) and the angle of reflection (r) respectively. The plane containing the incident ray and normal is called the plane of incidence. The laws of reflection as deduced from the experiments states that the reflected ray lies in the plane of incidence along with the normal at the point of incidence, and ∠i = ∠r.
Materials Required
A plane mirror with a support to hold it vertically, a drawing board, a sheet of white paper, a protractor, a measuring scale, pins, drawing pins or adhesive tape.
Procedure
- Fix a white sheet of paper on the drawing board using either adhesive tape or drawing pins.
- Draw a thin line SS′ in the middle of the paper. Also, draw a normal ON to the line SS′ at point O as shown in Fig. 34.2.
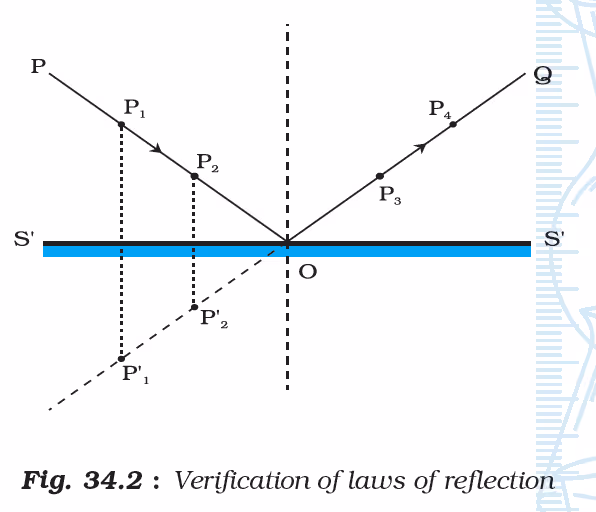
- Draw a thin line PO at any angle to the line SS′. Place the mirror vertically on line SS′ with the help of a support so that its polished surface faces line PO.
- Vertically fix two pins P1 and P2 with their tips, separated by a suitable distance of about 5 to 6 cm at two points on line PO. Look at the images P’1 and P’2 of pins P1 and P2 respectively from the same side of the plane mirror.
- Fix two pins P3 and P4 vertically so that their feet appear in the same straight line as those of images P’1 and P’2. Look through the feet of pins P1 and P2, and whether the feet of images (not shown in Fig. 34.2 of pins P3 and P4, as seen in the mirror appear to be on the same straight line. If it is so, you have correctly fixed the pins P3 and P4.
- Remove all the pins and the mirror. Mark the positions of the feet of pins P3 and P4. Draw a thin line OQ joining the points that mark the position of feet of pins P3 and P4. Also, extend this line till it meets the line SS’. This extended line should meet the surface SS’ at the point O. The line OQ shows the path of the reflected ray corresponding to the incident ray along the line PO, at the point of incidence.
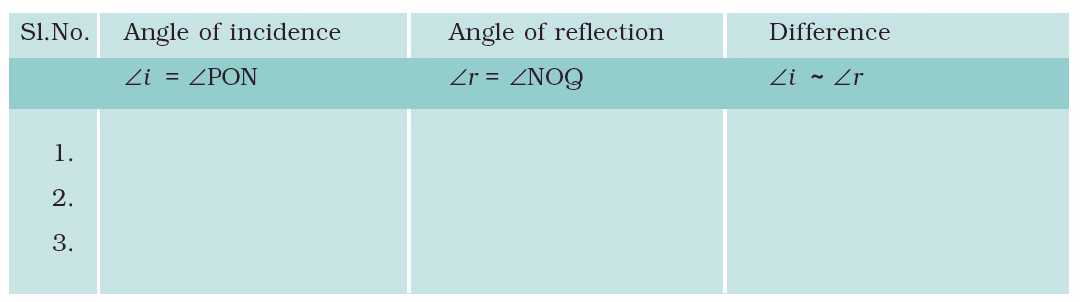
- Measure angles PON (∠i) and NOQ (∠r) and record the values in the observation table.
- Repeat the experiment for two more angles of incidence.
Observations and Calculations
Results and Discussion
- Does the reflected ray meet the point of incidence for all angles of incidence? Does the reflected ray lie in the plane of incidence? Explain based on your observations.
- Is the angle of incidence equal to the angle of reflection in each case? If not, is the difference between the two very large?
- As ∠ i = ∠ r, and the incident ray, normal and the reflected ray lie in the same plane, laws of reflection are verified.
Precautions
- The plane mirror must be placed vertically on the plane of the paper.
- Mirror should be made of thin glass with a smooth surface (Why? Otherwise many images may be formed due to multiple reflections). It should be of good quality with a good reflecting surface.
- The pins P1, P2, P3 and P4 fixed on the paper may not be exactly perpendicular (or vertical) to the plane of the paper, Thus, if their feet are collinear, their heads may not appear to be collinear. Therefore while marking the position of the pins on paper, the positions of their feet should be considered for drawing the lines to show the path of incident and the reflected rays. It is done by marking the position of the holes made by the pins.
- While fixing the pins to mark the reflected ray by viewing the images of pins fixed on the path of the incident ray, the eye must be kept at a distance from the pins so that the feet of all of them can be simultaneously seen clearly.
- The distance between P1 and P2; and P3 and P4 should not be less than about 5 to 6 cm so that the direction of incident ray and reflected ray can be located with a greater accuracy.
- The eye should be kept at such a position that the distance between the image of the pins and the eye is at least 25 cm. Also, while observing the image clearly, one eye should be closed.
- All lines drawn must be thin. A pencil with a sharp tip must be used for this purpose.
- The angles should be measured accurately by keeping the eye normally above the marking on the protractor.
Note for the Teacher
In case the mirror strip being used in this experiment is thick, one may find that the incident ray and reflected ray do not meet at the same point O on line SS′. This is because of the formation of multiple images due to multiple reflections. It is therefore strongly advised that a thin glass sheet must be used in this experiment. However, it is ideal to use a front-coated mirror.
The surface irregularities in glass may cause errors. For example, the angles of incidence and reflections may not appear to be equal. The mirror strip must be made up of very good quality glass.
Questions
- Can you obtain the image of a lighted candle placed in front of a plane mirror on a screen? Justify your answer.
- If the incident ray is perpendicular to the plane mirror, what will be the angle of reflection?
- An incident ray is reflected backwards along the same path, from a plane mirror. What is the angle of incidence?
- A pin is fixed at a distance of 5 cm in front of a plane mirror. Where and at what distance will the image be formed?
Chapter 11: Electricity
9. To study the dependence of the potential difference across a resistor on the current through it and to determine its resistance and to verify Ohm’s law.
Aim:
To study the dependence of the potential difference across a resistor on the current through it and to determine its resistance and to verify Ohm’s law.
Theory
According to Ohm’s law, the potential difference (V) across the ends of a resistor is directly proportional to the current (I) through it provided its temperature remains the same. That is
V∝I
or
V/I = constant = R
or V = RI
Here R is a constant for the given resistor at a given temperature and is called its resistance. The SI unit of resistance is ohm (W). A graph between the potential difference across the two ends of a resistor and the current through it is a straight line passing through the origin. The slope of this graph gives the resistance R of the resistor.
To verify Ohm’s law, we measure the potential difference across the two ends of a resistor at different currents through it in an electric circuit. The current through the resistor is measured by connecting an ammeter in series with it. The potential difference across the two ends of the resistor is measured by connecting the voltmeter in parallel with it. A straight line graph obtained between V and I verifies Ohm’s law.
Materials Required
A resistor of about 5 Ω, an ammeter ( 0 - 3 A), a voltmeter (0 - 10 V), four dry cells of 1.5 V each with a cell holder (or a battery eliminator), a plug key, connecting wires, and a piece of sandpaper.
Procedure
- Note the range and least count of the given ammeter and the voltmeter.
- Fresh connecting wires have an insulating layer on them. Similarly, the connecting wires lying unused for some time may also develop an insulating layer. (How?) It is therefore important to clean the ends of connecting wires using sandpaper.
- Draw a circuit diagram for studying Ohm’s law as shown in Fig. 48.1 in your notebook. Observe how different components like the ammeter, voltmeter, resistor, and plug key are connected with the cells (or battery eliminator).
- Set up the circuit by connecting different components with the help of connecting wires.
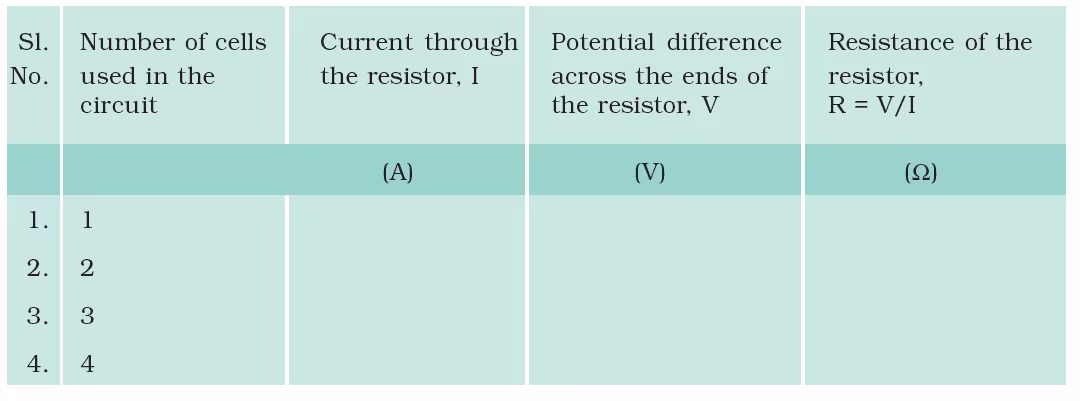
- Initially connect only one cell in the circuit (that is, make cell connections between points A and B). In case a battery eliminator is used, keep the rating of the eliminator at the minimum (say at 2 V).
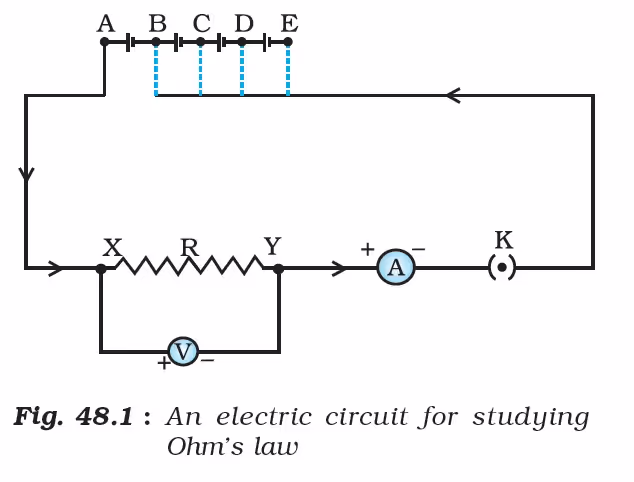
- Make sure that the positive and negative terminals of the ammeter and voltmeter are correctly connected in the circuit as shown in Fig. 48.1. Get the circuit set up by you and checked by the teacher before inserting the key into the plug.
- Insert the key in the plug to let the current establish in the circuit. Note the readings of the ammeter and voltmeter and record them. The voltmeter measures the potential difference (V) across the two ends X and Y of the resistor, and the ammeter measures the current I through it. Remove the key from the plug to avoid unnecessary heating of wires. How does it happen? Think it by the Joule’s law of heating.)
- Now instead of using one cell in the circuit, connect two cells in the circuit (that is, make cell connections between points A and C); in case a battery eliminator is used, increase its rating. Insert the key in the circuit. Note and record the voltmeter and ammeter readings.
- Repeat the experiment by connecting three and four cells in the circuit.
Observations and Calculations
(i) Range of the ammeter = ___ - ___ A.
(ii) Least count of the ammeter = ___ A.
(iii) Range of the voltmeter = ___ − ___ V.
(iv) Least count of the voltmeter = ___ V.
The mean value of resistance R of the resistor = _____ Ω
Graph
Find the range of variation in the values of I and V. Choose appropriate scales for the I and V along the x- and y-axes, respectively, on the graph paper. Mark the points on the graph paper for each value of current I and corresponding value of potential difference V (Fig. 48.2). Join all the points as a smooth line as possible, such that most of the points lie on it. Find the slope of this straight-line graph by choosing two points P and Q. This slope is the resistance of the resistor used in the circuit (Fig. 48.1).
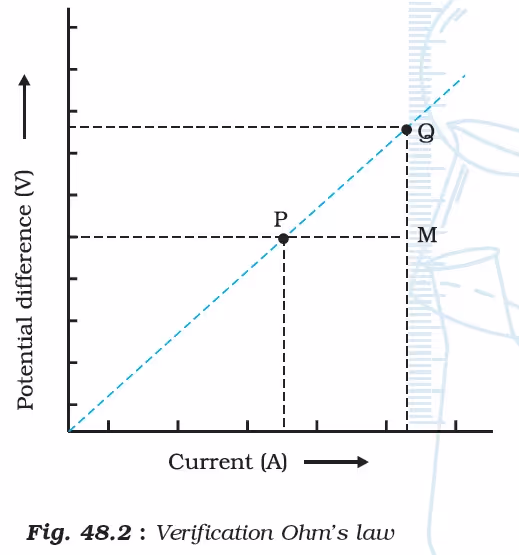
slope= QM/MP
Extend the straight line of the graph backwards to check whether it meets the origin of the graph paper.
Results and Discussion
- Compare the value of resistance R of the resistor obtained from the calculations (as given in the observation table) and obtained from the graph.
- The value of resistance R of the resistor for all values of current through it remains the same (or almost the same). The graph between V and I is a straight line and passes through the origin. This verifies Ohm’s law.
Precautions and sources of error
- The connecting wires should be thick copper wires, and the insulation of their ends should be removed using sandpaper.
- Connections should be tight; otherwise, some external resistance may introduce in the circuit.
- The ammeter should be connected in series with the resistor such that the current enters at the positive terminal and leaves at the negative terminal of the ammeter.
- A voltmeter should always be connected in parallel to a resistor. The pointers of the ammeter and voltmeter should be at the zero mark when no current passes through the circuit. If not, then ask your teacher to correct it.
- Current should be passed through the circuit for a short time while taking observations; otherwise, current would cause unnecessary heating in the circuit. Heating may change the resistance of resistors.
Note for the Teacher
- If a resistor of known resistance is not available, a piece of nichrome wire of suitable length may also be used.
- In place of dry cells, Leclanche and Daniel cells can be used. A battery eliminator may also be used. In case a battery eliminator is used, it is suggested to guide students accordingly while connecting it to the circuit and taking observations.
- If an accumulator or battery is used in place of cells or an eliminator to draw the current in the circuit, then a rheostat or variable resistance box can be used to change the current flowing through the circuit.
- In case your school laboratory possesses the voltmeter and ammeter of ranges other than the prescribed ranges, then the resistors may be so chosen that an appreciable deflection may appear in the ammeter and voltmeter.
Questions
- In this experiment, it is advised to take out the key from the plug when the observations are not being taken. Why?
- If the resistor of a known resistance value is replaced with a nichrome wire of 10 cm length (say). How do the values of current through the nichrome wire and potential difference across the two ends of it change? How will the values change if the replaced wire is of manganin in place of nichrome?
- Suppose in this experiment you see that the deflection on the ammeter (or voltmeter) scale goes beyond the full scale. What will you infer from such an observation? What will you infer if the deflection takes place in the opposite direction?
Chapter 12: Magnetic Effects of Electric Current
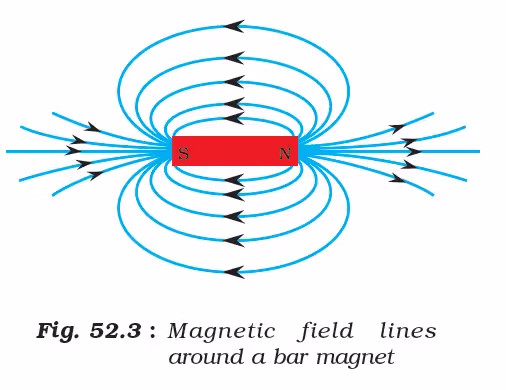
10. To draw magnetic field lines of a bar magnet.
Aim:
To draw magnetic field lines of a bar magnet.
Theory
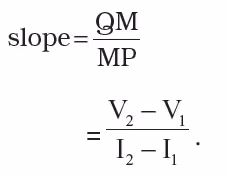
A field of force that exists around a bar magnet is called its magnetic field. We see that when iron filings are sprinkled around a bar magnet, they arrange in a particular pattern as shown in Fig. 52.1. The lines along which the iron filings orient themselves represent magnetic field lines. These lines are closed curves and do not intersect each other. These field lines are crowded around the poles of the magnet. The degree of their closeness represents that the magnetic field is stronger at the poles.
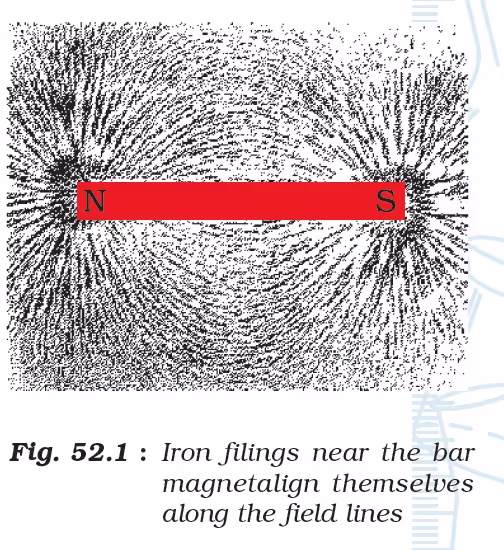
The magnetic field lines around a bar magnet can be obtained using a compass needle. A compass needle is a small magnet. Its one end, which points towards the north, is called its north pole, and the other end, which points towards the south, is called the south pole.
Materials Required
A bar magnet of about 10 cm, a small compass needle, iron filings, a drawing board, adhesive tape or drawing pins of brass, and white paper sheets.
Procedure
(a) To observe the pattern of iron filings around a bar magnet
- Fix a sheet of white paper on a drawing board using adhesive tape or drawing pins of brass.
- Place a bar magnet on this sheet in the middle of it.
- Sprinkle iron filings around the bar magnet and gently tap the drawing board till a pattern, as shown in Fig. 52.1, is formed.
- Observe the pattern. What does it show? Notice that the iron filings are crowded around the poles of the bar magnet.
- Remove the iron filings from the paper.
(b) To draw the magnetic field lines around a bar magnet
- Identify the north and south poles of the bar magnet. Place the bar magnet in the middle of the paper. Mark the position of north and south poles and also draw the boundary of the bar magnet.
- Place a small compass needle very near the north pole of the magnet.
- You will observe that the south end of the compass needle aligns itself towards the north pole of the bar magnet.
- Mark the positions of the two ends of the compass needle.
- Move the compass to a new position such that its south end occupies the position previously occupied by its north pole.
- In this way, proceed step by step until you reach the magnet's south pole, as shown in Fig. 52.2.
- Join the points marked on paper by a smooth curve. This curve represents a field line.
- Repeat the above procedure and draw as many lines as you can. You will get a pattern like the one shown in Fig. 52.3. You might have noticed that the deflection in the compass needle is more when it is placed closer to one of the poles of the magnet.
Observations and Calculations
The attached paper sheet shows the pattern of magnetic field lines drawn around the bar magnet.
Results and Discussion
From the magnetic field lines around a bar magnet, it may be confirmed that:
- The magnetic field lines are closed and continuous.
- The deflection in the compass needle increases as it moves towards the poles.
- Two magnetic field lines do not intersect, and
- The magnetic field lines are crowded at the poles of the bar magnet.
Precautions
- There should not be any other magnetic material near the bar magnet except the compass needle while drawing the magnetic field lines.
- The size of the compass needle should be small.
- The bar magnet should be sufficiently strong to produce an appreciable deflection in the compass needle placed at a distance of 15 cm from the bar magnet.
Note for the Teacher
- If it is found that this experiment, as explained, is difficult to perform within the given time, it may be suggested to draw the magnetic field lines only. The first part to observe the pattern of iron filings around a bar magnet may be skipped.
- The north and south poles of a bar magnet can be identified using another magnet of known polarity.
- A small compass needle should be used for drawing the field lines so that a sufficient number of field lines can be drawn on a sheet of paper.
- It is advised to place the north and south poles of the bar magnet in the north-south direction. This is to avoid the variation in field patterns due to the effect of the earth's magnetic field.
Applications
This method can be used to identify the magnetic materials. The strengths of two bar magnets can also be compared.
Questions
- You are provided with an iron strip and a bar magnet. How will you distinguish them?
- How does a compass needlework?
- How will you make a compass using an iron needle, a piece of thermo-cole and a magnet?
- Why does the needle of a compass point north and south?
- What does the degree of closeness of magnetic field lines indicate?
- Why are more iron filings concentrated around the poles of the magnets?
- What will happen if a small compass needle is replaced with a big size compass needle?
Exemplar Project Write-ups: CBSE Class 10 Science Lab Manual
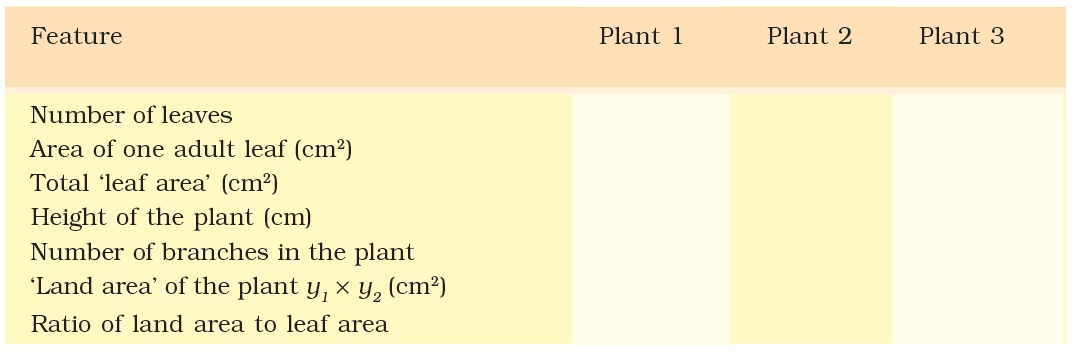
Land Area and Leaf Area of a Plant
1. To establish a relationship between the ‘land area’ and the total ‘leaf area’ of a plant.
Aim: To establish a relationship between the ‘land area’ and the total ‘leaf area’ of a plant.
Theory
Plants that we see around us are of different sizes and shapes. Some plants such as the garden ornamental herbs are very small and live for a few months only while others like coconut, mango, peepal, banyan etc. are large and also live for several years. The majority of terrestrial plants, irrespective of their size, are erect and exhibit various types of branching. Each individual plant requires a minimum land area for its existence and this is dependent on the size of the plant and the dimension of its canopy. Within this land area, it may allow a few smaller plants to grow but not any other plant of its dimension. This principle also applies to smaller plants like herbs. Plants adapt to the land area that they have occupied to lead a normal life. However, these plants will have to maximize their leaf area to harness maximum sunlight for the process of photosynthesis. Through this project let us find out the leaf area of some plants and see its relationship with the land area of that plant.
Hypothesis
- The land area of a plant is smaller than its leaf area;
- Larger plants like trees require more land area than smaller plants like herbs;
- There is no relationship between the land area and the leaf area of a plant.
Materials Required
A potted herbaceous plant with broad leaves such as Petnia/Balsam/ Hibiscus/Croton/Coleus/Flox/Salvia) or any other locally available similar plant, thread, measuring scale, and graph paper.
Procedure
- Select an adult, flowering, ornamental herb from among the plants listed above and mark it as an experimental plant (tie a small piece of thread for identification).
- Pluck one adult leaf of the plant and trace its outline on a graph sheet. Count the number of squares that lie within the margins in the area of the leaf lamina and calculate the area of the leaf.
- Count the number of leaves in the plant. Count even the smallest visible leaf and note the number in your book.
Calculate the total ‘leaf area’ of the plant by the formula.
Total leaf area = Area of one adult leaf × number of leaves in the plant (cm2).
- Measure the width of the plant at the broadest points. This can be done by measuring the distance (in cm) between the tips of two oppositely inserted adult leaves by holding them perpendicular to the stem (y1).
- Calculate the width at right angles to the orientation of the pair of leaves with which you took the first readings (y2).
Calculate the land area that is, y1 × y2 (cm2).
- Measure the height of the experimental plant and record it in the tabular column.
- Repeat the experiment with two more experimental plants of the same species.
- Calculate the ratio of land area to leaf area of all the plants studied and work out a relationship between these two parameters.
Observations
Discussion
Based on the values obtained, students will be able to establish relationship between the land area and leaf area of a plant. The ratio can be extrapolated to estimate the land area and leaf area of a tree in the vicinity.
Rusting of Iron
2. To study the rusting of iron and to identify the conditions for rusting.
Aim: To study rusting of iron and to identify the conditions for rusting.
Theory
The surface of iron when comes in contact with the moist air gets rusted. The rust so formed is hydrated iron (III) oxide (Fe2O3.xH2O). Thus rusting is a process of oxidation of iron that takes place in the presence of both air and moisture. In this project work, we shall study the factors causing the rusting of iron.
Materials Required
Anhydrous calcium chloride (2 g), oil, distilled water, fifteen iron nails, three test tubes, a measuring cylinder (50 mL), a beaker, three corks, a burner, a tripod stand, a dropper, and a piece of sandpaper.
Procedure
Take three test tubes and label them as tubes A, B, and C.
Take about 10 mL of distilled water in tube A and about 15 mL of boiled distilled water in tube B. Also pour a small amount of oil into tube B to make a layer on the boiled distilled water. In tube C place about 2 g of anhydrous calcium chloride. Place all three tubes in a test tube stand.
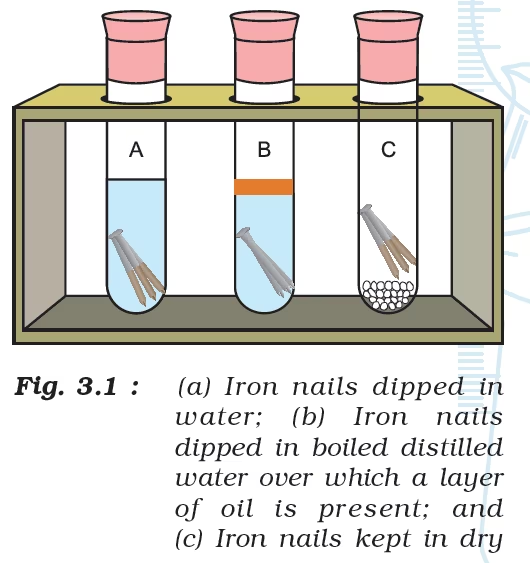
- Take a few iron nails and clean them by rubbing with a sandpaper.
- In tube A, dip two or three rust-free clean iron nails in distilled water. Cork the test tube tightly.
- In tube B, put a few rust-free clean iron nails in boiled distilled water over which a layer of oil is present. Cork the test tube tightly.
- In tube C, insert a few rust-free iron nails in anhydrous calcium chloride. Tightly cork the tube to make it airtight.
- Leave the set-up of three tubes for three or four days. Note and record your observations.
Observations

Results and Discussion
On the basis of observations infer how distilled water produces rusting on iron nails; how oil treatment reduces rusting and how it happens in the presence of anhydrous calcium chloride. Now suggest methods to avoid rusting of metals like iron. Also check and comment on the nature of rust.
Additional Class 10 Science Activities
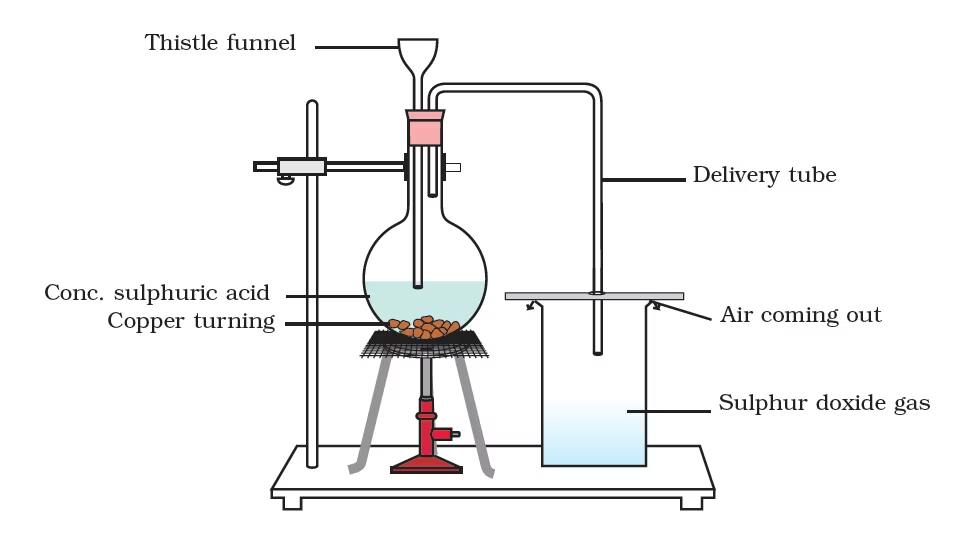
1. To prepare sulphur dioxide gas and study its physical and chemical properties.
Aim: To prepare sulphur dioxide gas and study its physical and chemical properties.
Theory
Sulphur dioxide is prepared by the action of hot concentrated sulphuric acid on copper turnings.

Sulphur dioxide is acidic in nature. It decolourises acidified potassium permanganate (KMnO4 ) solution. Acidified potassium dichromate solution (K2Cr2O7 ) is also turned green by SO2 . The reactions with KMnO4 and K2Cr2O7 are due to the reducing property of SO2 and oxidising nature of acidified KMnO4 and K2Cr2O7 .
Or, 2KmNO4 + 5SO2 + 2H2O → K2SO4 +2MnSO4 +2H2SO4
Similarly,
K2Cr2O7 + 4H2SO4 →K2SO4 + Cr2(SO4)3 + 4H2O + 3[O]
[SO2+H2O+[O] → H2SO4 ] X3
Or, K2Cr2O7 + H2SO4 +3SO2→K2SO4 + Cr2(SO4)3 + H2O
Materials Required
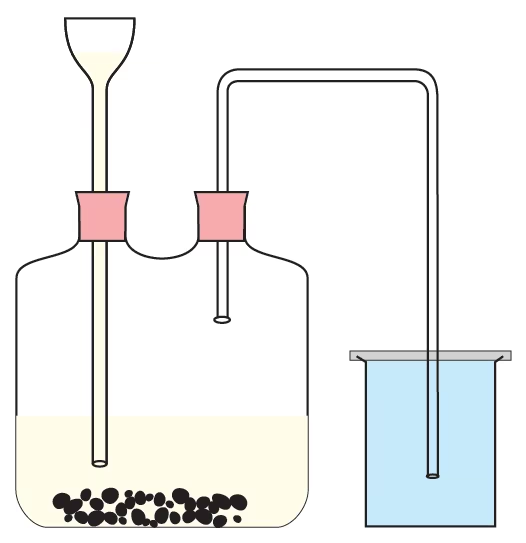
Copper turnings, conc. sulphuric acid, dil. sulphuric acid, potassium permanganate solution, potassium dichromate solution, red and blue litmus papers, a round bottom flask, a thistle funnel, a delivery tube, a double bored cork, a piece of card board as a lid, a laboratory stand, a burner, a wire gauze, a tripod stand, two test tubes, a trough, a measuring cylinder (50 mL), and a gas jar.
Procedure
- Place a few pieces of copper turnings (about 5 g) in a round bottom flask and arrange the apparatus as shown in Fig. 14.1.
- Add 15 - 20 mL of conc. sulphuric acid to it through a thistle funnel.
- Place the cork in its position on the flask again and heat the contents gently. The gas formation starts after sometime.
- Collect the gas in the gas jar and study its properties as per the steps given in the observation table.
Observations:
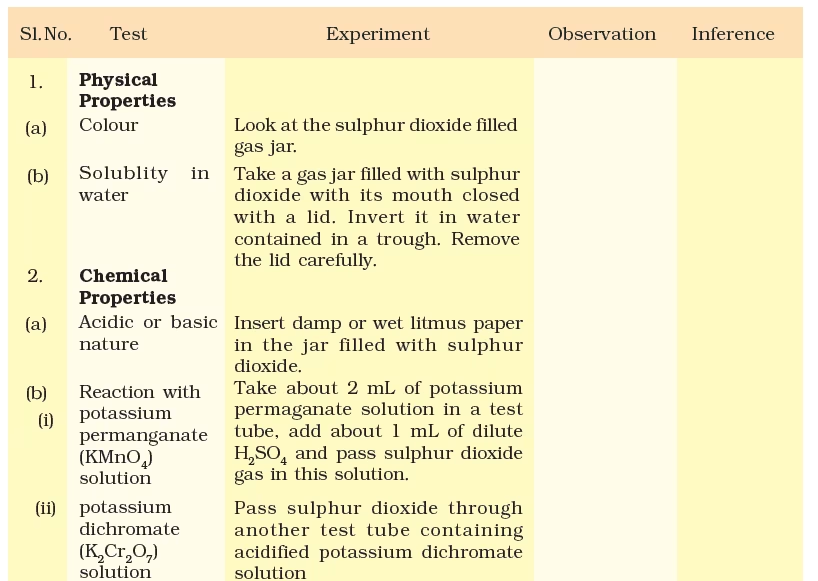
Results And Discussion
Infer the observations and note your inferences in observation table. On the basis of observations mention the physical and chemical properties of the liberated sulphur dioxide gas. Solubility of SO2 in water is a chemical property on account of the following reaction.
SO2 (g) + H2O (l) → H2 SO3 (l)
SO2 is both oxidising and reducing in its behaviour as, it can take as well as supply oxygen.
Precautions
- Keep the apparatus for preparation of gas airtight.
- Concentrated sulphuric acid should be handled carefully. It should not touch your skin.
- Avoid adding large quantity of acid at a time, otherwise a vigorous reaction may occur. Care should be taken while handling hydrochloric acid. It should not touch the skin.
- Do not inhale sulphur dioxide.
Note for the Teacher
Sulphur dioxide can also be prepared by
Na2 SO3 (aq)+ dil. H2 SO4 (aq) → Na2 SO4 (aq) + H2O (l) + SO2 (g)
Questions
- What type of reaction (oxidation or reduction) does sulphuric acid undergo during the laboratory preparation of sulphur dioxide?
- What happens when sulphur dioxide is passed through an acidified potassium permanganate solution?
- Why is sulphur dioxide collected by the upward displacement of air?
- What are the different roles of H2 SO4 in chemical reactions? Justify your answer with an example of each?
- Identify the role (oxidant or reductant) of each gas in the following reaction:
2H2 S (g) + SO2 (g) → 3S (s) + 2H2O (l)
- What conclusion do you draw about the two metals here?
2. To prepare carbon dioxide gas and study its physical and chemical properties.
Aim: To prepare carbon dioxide gas and study its physical and chemical properties.
Theory
In a laboratory, carbon dioxide gas (CO2) may be prepared by the action of dilute acids on calcium carbonate. Calcium carbonate is usually taken in the form of marble chips.
CaCO3 (s) + 2HCl (aq) → CaCl2 (aq) + H2O +CO2(g)
Carbon dioxide gas is acidic in nature. It is also an oxidising agent. It turns a red litmus paper blue and turns lime water [Ca(OH)2 (aq)] milky.
Ca(OH)2 (aq) + CO2 (g) → CaCl3 (s) + H2O(l)
On passing excess CO2 through lime water, calcium hydrogencarbonate is formed. It is soluble in water and forms a colourless solution.
CaCO3 (s) +H2O(l)+ CO2 (g) → Ca(HCO3)2 (aq)
Materials Required
Marble chips (10 g), dil. hydrochloric acid, red and blue litmus paper strips, freshly prepared lime water, a small piece of magnesium ribbon, Woulfe’s bottle or a round bottom flask, a gas jar, a measuring cylinder (50 mL), a thistle funnel, a delivery tube, two single bored corks, a trough, a candle, and a piece of cardboard,
Procedure
- Take about 10 g of small pieces of marble chips in a Woulfe’s bottle and set up the apparatus as shown in Fig. 15.1.
- Add, dropwise, 10 mL of dil. hydrochloric acid to the Wolfe’s bottle through the thistle funnel.
- Do you see any reaction taking place in the Woulfe’s bottle? Do you see any gas formation?
- Collect the liberated gas in a gas jar to perform the colour, odour, solubility in water, combustibility and acidic tests. Record your observations in the observation table.
- Pass the liberated gas through freshly prepared lime water in a test tube. Do you see any gas bubbles in the lime water? Does the colour of lime water turn milky?
Observations:
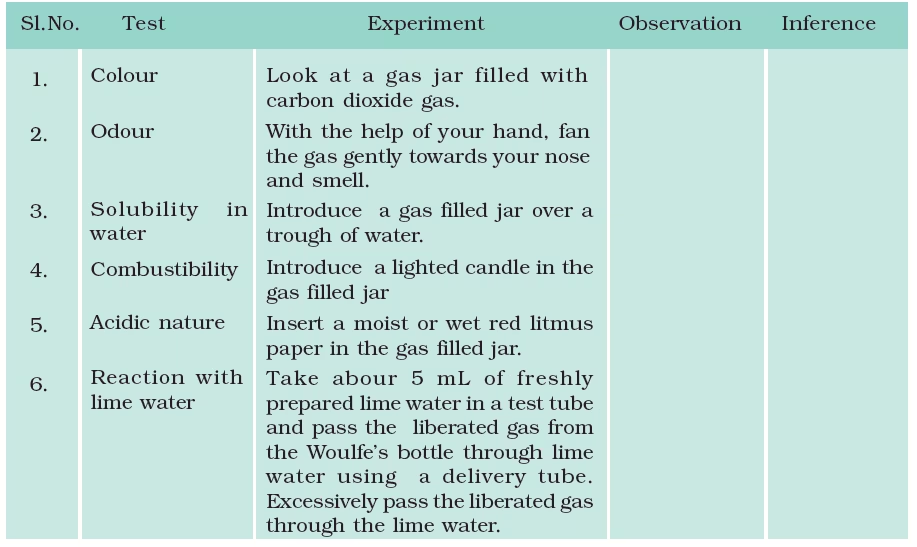
Results and Discussion
Infer the observations and note your inferences in the observation table. On the basis of observations mention the properties of liberated gas.
Precautions
The apparatus should be airtight.
The lower end of the thistle funnel should be dipped in the acid taken in Woulfe’s bottle otherwise carbon dioxide will escape through the thistle funnel.
Avoid adding a large quantity of acid at a time, otherwise, a vigorous reaction may occur. Care should be taken while handling hydrochloric acid. It should not touch the skin.
While collecting the gas in the jar, a piece of cardboard should be placed over the mouth of the gas jar.
Note for the Teacher
- Preparation of lime water: Shake about 5 g of calcium oxide, CaO, with 100 mL water. Allow it to stand for 24 hours. Decant the supernatant liquid and use it for the tests. Always use freshly prepared limewater.
- It is not necessary to set up the Woulfe’s apparatus for preparing the carbon dioxide gas. This set up is needed for collecting the gas in a jar. The reaction may also be carried out in a test tube.
- In this experiment dil. H2 SO4 may also be used in place of dil. HCl. It forms CaSO4 on reacting with marble chips. In this reaction, initially CO2 is liberated but with time a layer of CaSO4 deposits on CaCO3 and this will stop the reaction and no CO2 will form.
Questions
- Why is carbon dioxide collected by upward displacement of air?
- Sulphuric acid is not used for preparing the carbon dioxide gas in the laboratory. Why?
- Why is a lighted candle put off when inserted in the jar of carbon dioxide?
- What is the chemical name of the compound formed when carbon dioxide gas is passed through limewater?
- What is the effect of carbon dioxide gas on moist blue litmus paper? • How can you prove that we exhale (breathe out) carbon dioxide?
- What happens when an excess of CO2 is passed through lime water? Write the chemical equation for the reaction involved.
3. To study the process of electrolysis.
Aim: To study the process of electrolysis.
Theory
An electrolyte is a compound that, in solution or in the molten state, dissociate into ions and conduct an electric current. On passing an electric current from an external source, these ions migrate towards the oppositely charged electrodes. Positive ions migrate to the negative electrode and negative ions to the positive electrode and they discharge at respective electrodes. This phenomenon is called electrolysis and the container in which electrolysis occur is called electrolytic cell. In this experiment, we take an aqueous solution of copper sulphate as an electrolyte; a strip of pure copper metal as cathode; and a strip of impure copper as an anode. When an electric current is passed through the aqueous solution of copper sulphate, copper ions (Cu2+) migrate towards the pure copper strip cathode, get discharge and deposit over it. Sulphate (SO2-4 ) ions move towards the impure copper anode, dissolve their copper into the solution as copper ions and thus keep their concentration constant in the solution.
Materials Required
An impure thick copper metal strip, a thin pure copper metal strip, copper sulphate crystals, distilled water, dil. sulphuric acid, two dry cells with a cell holder (or a battery of 3 V or a battery eliminator), a plug key, a beaker (250 mL), a measuring cylinder (50 mL), physical balance with weight box, a small cardboard with two holes, connecting wires, and a piece of sand paper.
Procedure
- Take a beaker to use it as an electrolytic cell.
- Dissolve about 3 g of copper sulphate crystals in 100 mL distilled water and pour this solution in the electrolytic cell. Add to it about 1 mL of dil. sulphuric acid to make the solution acidified.
- Clean the ends of the connecting wires using a sand paper.
- Connect two wires with the two copper strips to be considered as positive electrode (impure copper strip) and negative electrode (pure copper strip). Pass these strips through the two holes of the car dboar d(Fig. 16.1).
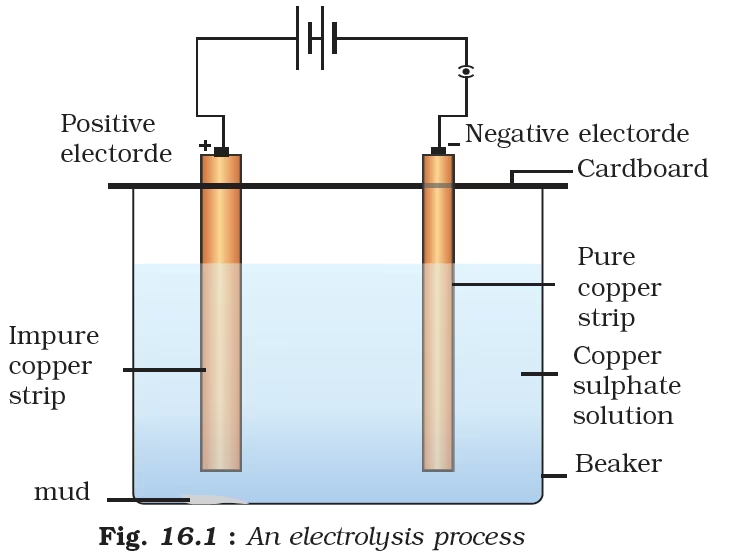
- Connect the two copper strips with a combination of two dry cells (in a cell holder) through a plug key as shown in Fig. 16.1. [In place of cells a battery of 3 V or a battery eliminator may also be used.] Do not plug in the key.
- Immerse the two copper strips into the solution and cover the beaker with the cardboard.
- Insert the key into the plug to allow the electric current to pass through the electrolytic solution.
- Observe the electrolytic solution after sometime. Do you find any change in the thickness(es) of the two copper strips? Note your observations. If not, allow the current to flow through the electrolyte for more time till you observe a change in the thickness of the two copper strips.
Observations
The thickeness of impure copper strip (positive electrode) decreases whereas the thickness of pure copper strip (negative electrode) increases on passing an electric current through the acidified copper sulphate for some time.
Results and Discussion
In this electrolysis process, copper ions are released from the impure copper strip (positive electrode). These ions move through the solution in the electrolytic cell towards the pure copper strip (negative electrode). Here they get discharged and deposited. That is how the thickness of impure copper strip keeps on decreasing and the thickness of pure copper strip keeps on increasing on passing the current through the electrolyte. Discuss the role and movement of sulphate ions in the solution.
Precautions
- Copper sulphate is poisnous in nature. Handle it carefully.
- A thin strip of copper (negative electrode) should be of pure metal (why?).
- Never keep the two electrodes close to each other in the electrolytic cell. Similarly, the two electrodes should not touch the sides of the cell.
Note for the Teacher
Instead of impure and pure copper strips, loops of copper wire can also used as two electrodes. The purpose of electrolysis is electroplating. In fact any conducting material can be used as cathode over which the copper can be deposited.
Oxidation is also described as loss of electrons and takes place at anode for example in the reaction under discussion. Cu (s) + SO4 2– (aq) → CuSO4 (aq) + 2e–
Reduction is gain of electrons and takes place at cathode and here it occurs in the following manner. Cu2+ + 2e- → Cu(s)
A little quantity of dil. sulphuric acid is added to acidify the copper sulphate solution to avoid its hydrolysis, failing which the precipitation of copper hydroxide will take place
Questions
- What is electrolysis?
- How will you come to know that copper is deposited on cathode at the end of the experiment?
- What will happen to the impurities present in the impure copper strip (positive electrode)?
- These days aluminium vessels by the name of ‘anodised aluminium’ are available in the market. How are these prepared?
4. To draw the images of an object, formed by a concave mirror, when the object is placed at various positions.
Aim: To draw the images of an object, formed by a concave mirror, when the object is placed at various positions.
Theory
A concave mirror (a spherical mirror), like a plane mirror, obeys the laws of reflection of light. The nature, position and relative size of the images, formed by a concave mirror, of an object placed at various positions depend on the position of the object concerning the pole of the concave mirror. The formation of images by a concave mirror can also be studied by drawing ray diagrams, using the new cartesian sign convention (Fig. 35.1). In this convention, the pole (P) of the mirror MN is taken as the origin and its principal axis as the x-axis (X’X) of the coordinate system. According to this convention: (i) The object is always placed to the left of the mirror. This implies that the light from the object falls on the mirror from the left-hand side;
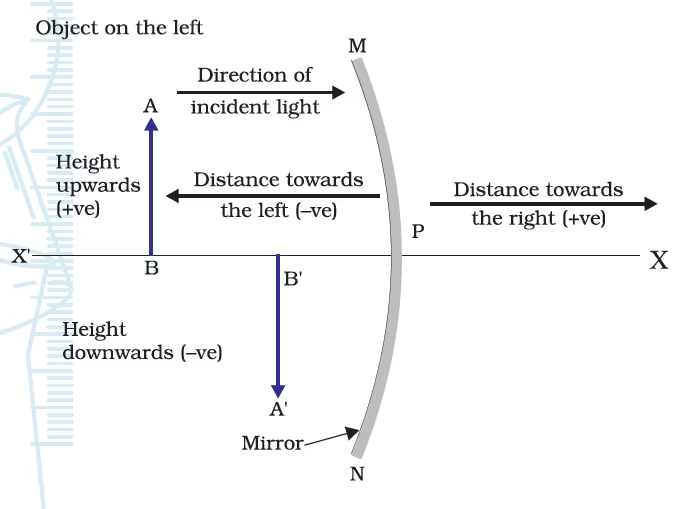
(ii) All distances parallel to the principal axis are measured from the pole of the mirror;
(iii) All distances measured to the right of the origin (that is along the +x-axis) are taken as positive while those measured to the left of the origin (that is along the –x-axis) are taken as negative;
(iv) Distances measured perpendicular to and above the principal axis (that is along the +y-axis) are taken as positive; and
(v) Distances measured perpendicular to and below the principal axis (that is along the –y-axis) are taken as negative. For an extended object AB of finite size, placed in front of a concave mirror, each small portion is assumed to act like a point source. An infinite number of rays of light originate from each of these point sources which could be considered for drawing the ray diagrams to locate the image of object AB. For the sake of clarity of the ray diagram, only two rays are considered and so chosen to know their directions easily after reflection from the concave mirror. Fig. 35.2 illustrates the ray diagrams for the path of incident rays after reflection from the concave mirror. The intersection of at least two reflected rays gives the position of the image of the point object. Any two of the following rays can be considered for locating the image by a concave mirror:
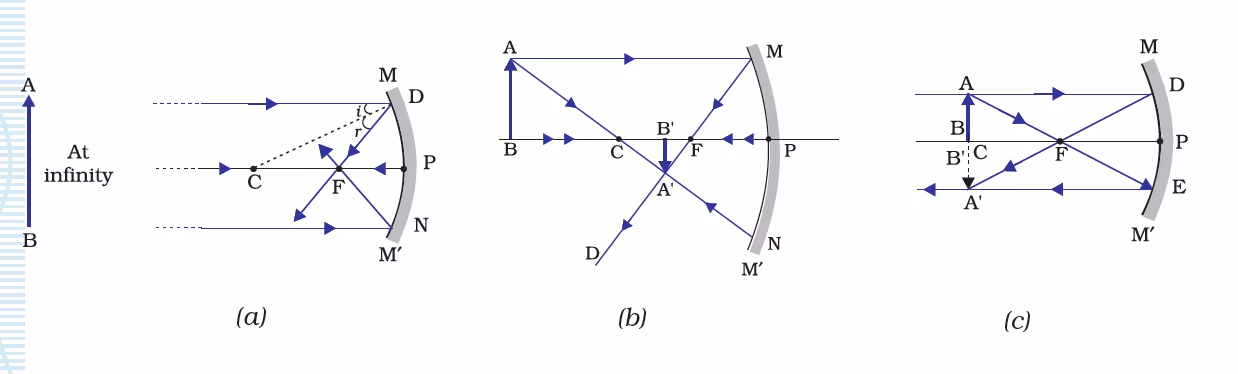
(i) A ray parallel to the principal axis, after reflection, will pass through the principal focus F [Fig. 35.2(a)].
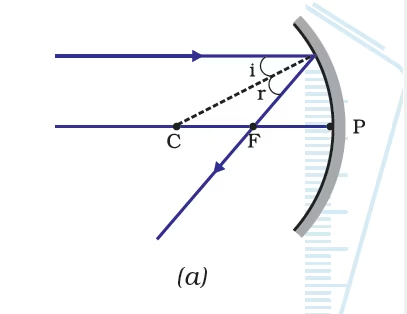
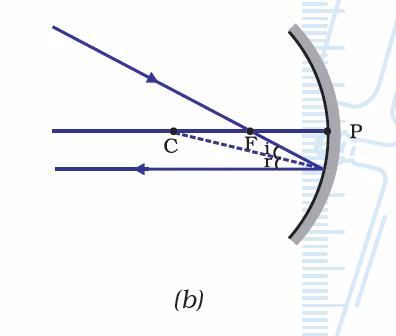
(ii) A ray passing through the principal focus F of a concave mirror, after reflection, will emerge parallel to the principal axis [Fig. 35.2(b)].
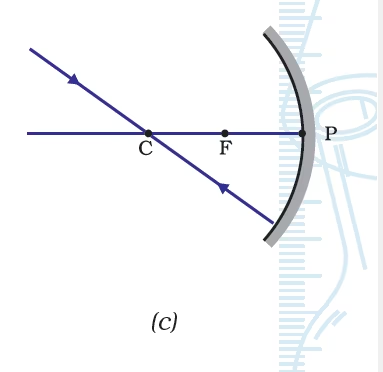
(iii) A ray passing through the centre of curvature C of a concave mirror, after reflection, is reflected back along the same path [Fig. 35.2(c)]. The light rays come back along the same path because the incident rays fall on the mirror along the normal to the reflecting surface.
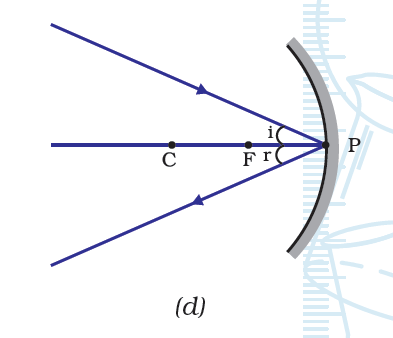
(iv) A ray incident obliquely to the principal axis, towards a point P (pole of the mirror), on the concave mirror [Fig. 35.2(d)], is reflected obliquely. The incident and reflected rays follow the laws of reflection at the point of incidence (point P), making equal angles with the principal axis.
Neat ray diagrams can be drawn for various positions of an object in front of a concave mirror, using the new cartesian sign convention (Fig. 35.1) and convenient rays for locating Fig. 35.2. It may be considered that the concave mirror is thin and that it has a small aperture (Is it necessary?). The nature, position and relative size of the image formed in each case may then be determined. Normally the spherical mirrors used in school laboratories are polished at the back of a thin transparent glass strip.
Materials Required
Drawing board, measuring scale, white paper, a pair of compasses, protractor, drawing pins or adhesive tape.
Procedure
- Fix a white sheet of paper on a drawing board with the help of adhesive tape or drawing pins. At the centre of the white sheet, draw a thin line CP of about 10 - 12 cm in length.
- Place the tip of the compass at point C and draw an arc to represent a concave mirror MM′ as shown in Fig. 35.3(a). Here, C represents the centre of curvature, point P the pole, and distance CP the radius of curvature R of the concave mirror.
- Draw rays from a distant object AB assumed to be placed at infinity in Fig. 35.3(a). Draw two lines, representing incident rays with arrows (to show the direction of the ray), on the surface of the concave mirror MM′ at points of incidence D and N respectively.
- Join points D and N to point C by a dotted straight line. Then, lines CD and CN are normal to the curved surface MM′ at the points D and N respectively. Here ∠ADC = ∠BNC = ∠i, the angle of incidence at points D and N. Measure these angles of incidence in each case.
- The incident light rays AD and BN will be reflected by the mirror MM′ at angles equal to angles of incidence (= ∠i) at points D and N. For this, draw a line DF with an arrow, meeting the principal axis at F, such that ∠CDF equals ∠ADC. The ∠CDF is the angle of reflection at the point D (that is, ∠CDF = ∠r). Similarly, draw a line from point N, meeting the principal axis at a point, such that the angle of reflection for the incident ray BN with the normal CN is equal to ∠BNC (= ∠i). Does this reflected ray from point N also meet the principal axis at point F? If so, draw the line NF (as the reflected ray) and mark ∠CNF = ∠r, the angle of reflection at the point of incidence N. Then, the point F is the principal focus of the concave mirror.
- Measure the lengths CF and FP. Is CF = FP? (Ideally, the point F must lie mid-way between the points C and P.)
- Draw a line CP with an arrow to represent the incident ray falling normally on the mirror MM′ at the pole of the mirror, P. This ray, after reflection, will pass through the principal focus F. Draw the line PC with an arrow at the point of incidence P. In this situation, the reflected ray PC retraces its path in the opposite direction to the incident ray.
- The reflected rays DF, NF, and PC meet at the principal focus F. Thus the image of the distant object AB (placed at infinity) is formed at the point F, as shown in Fig. 35.3(a).
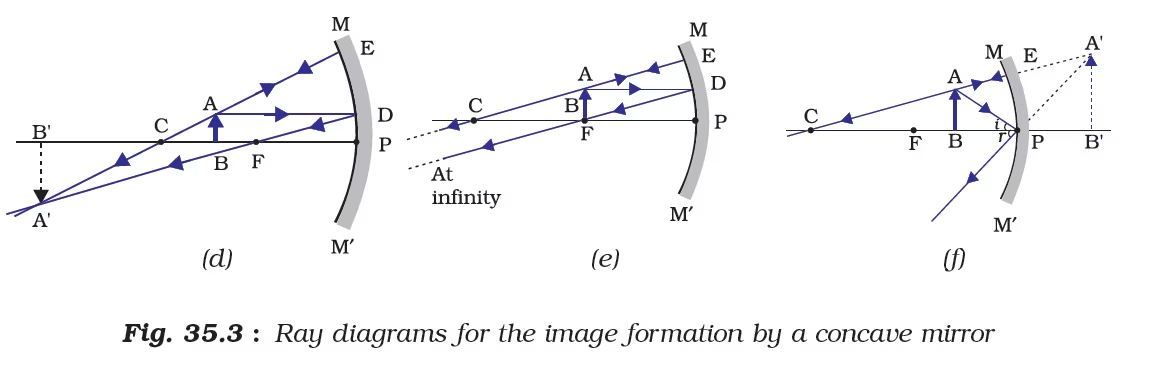
- Repeat the above steps, using the New Cartesian Sign Convention (Fig. 35.1) and considering relevant rays for locating the image. Draw neat ray diagrams for each position of the object placed beyond the centre of curvature C [Fig. 35.3(b)]; at the centre of curvature C [Fig. 35.3(c)]; between the centre of curvature C and principal focus F [Fig. 35.3(d)]; at the principal focus F [Fig. 35.3(e)]; and between the pole P and the principal focus F [Fig. 35.3(f)].
- Measure the height h and h′, using the scale of the object AB and its image A′B′ respectively, formed by the concave mirror MM′ in the ray diagram drawn in each case of Figs. 35.3(b) to (f). Record them in the observation table.
- Describe the nature, position and relative size of the image, formed by the concave mirror, of the object placed at various positions. Tabulate the results in the observation table.
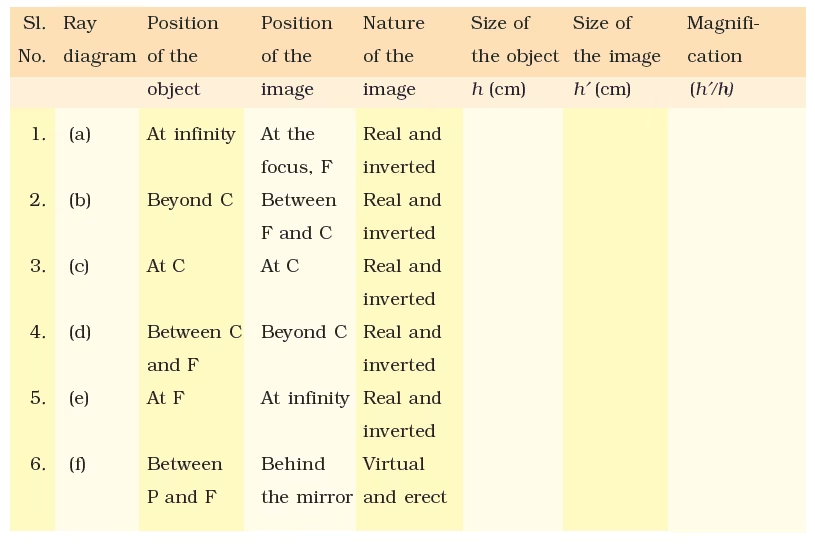
Observations
Formation of image of an object placed at different location/position in front of a concave mirror as illustrated in ray diagrams in Fig. 35.3:i.
Precautions
- Use a sharp tip pencil to draw the thin lines to represent incident and reflected rays, and also all other lines.
- Measure the angles of incidence and reflection, using protractors of very good quality with clear markings. ´ The tip of a pair of compasses should be sharp for drawing the concave mirror.
- The concave mirror drawn should be thin and of small aperture and sufficiently large radius of curvature for locating a distinct image.
Note for the Teacher
- The position F of a concave mirror should not be marked midway between C and P in a ray diagram illustrated in Fig. 35.3 (Why?). Its position on the principal axis should be found, using the laws of reflection of light.
- The ray diagrams for the formation of images of an object by a concave mirror can also be drawn on graph paper. This might facilitate students in making all measurements.
Questions
- Sometimes the image formed by a concave mirror of an object placed at C is not of the same size and at location C. What could be the possible reason(s) for such a situation?
- In what way will the position and size of the image be affected if the pencil used for drawing ray diagrams is not sharp and thin?
- What is the advantage of joining point C with the point of incidence D, while drawing ray diagrams for the image formation by a concave mirror?
5. To determine the focal length of a concave mirror by obtaining an image of a distant object.
Aim: To determine the focal length of a concave mirror by obtaining an image of a distant object.
Theory
A concave mirror, like a plane mirror, obeys the laws of reflection of light. The rays of light coming from a distant object such as the sun (or a distant tree or building principal
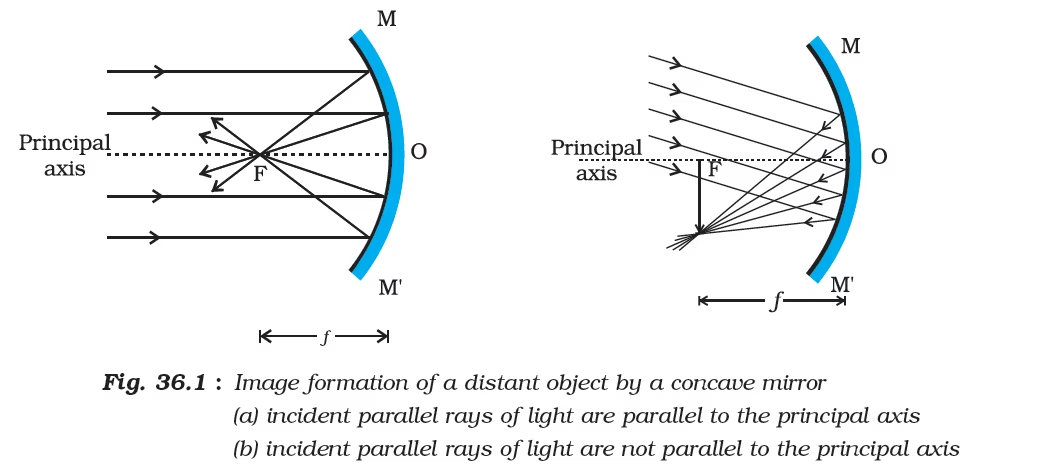
axis tree or a distant building) can be considered to be parallel to each other. When parallel rays of light fall on a concave mirror along its axis, the rays. This point is the focus of the mirror. For a parallel beam of light coming from a distant object, a real, inverted and very small image size is formed at the focus of the mirror [Fig. 36.1(a)]. Since the image formed by the mirror is real, it can be obtained on a screen. The distance between the pole O of the concave mirror and the focus F is the focal length of the concave mirror. Thus, the focal length of a concave mirror can be estimated by obtaining a real image of a distant object at its focus.
Materials Required
A concave mirror, a mirror holder, a small screen fixed on a stand, and a measuring scale.
Procedure
- Fix a concave mirror in the mirror holder and place it on the table near an open window. Turn the face of the mirror towards a distant object (a tree or an electricity pole or a distant building).
- Place the screen fitted to a stand in front of the concave mirror. Move the screen back and forth until a sharp, clear and inverted image of the distant object is formed on it (Fig. 36.2). A clear and bright image could be obtained if the distant object, say a tree or a building, is illuminated with sunlight and the screen is placed in the shade. A bright image of the sun could also be obtained if the sunlight is made to fall directly on the concave mirror.
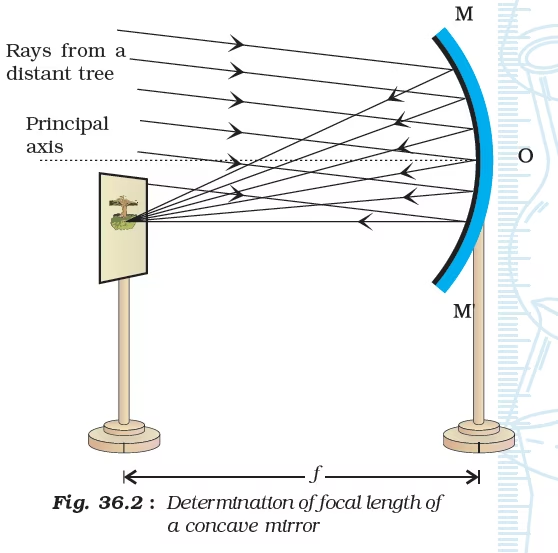
- Mark the position of the centre of the stand holding the mirror and the screen when a sharp image of the distant object has been obtained on the screen. Measure the horizontal distance between the centre of the concave mirror and the screen with the help of a measuring scale. Record your observations in the observation table. Principal axis Rays from a distant tree
- Repeat the experiment two more times by obtaining the images of two different distant objects. Measure the distances between the concave mirror and the screen in each case. Record them in the observation table.
- Find the mean value of the focal length.
Observations and Calculations
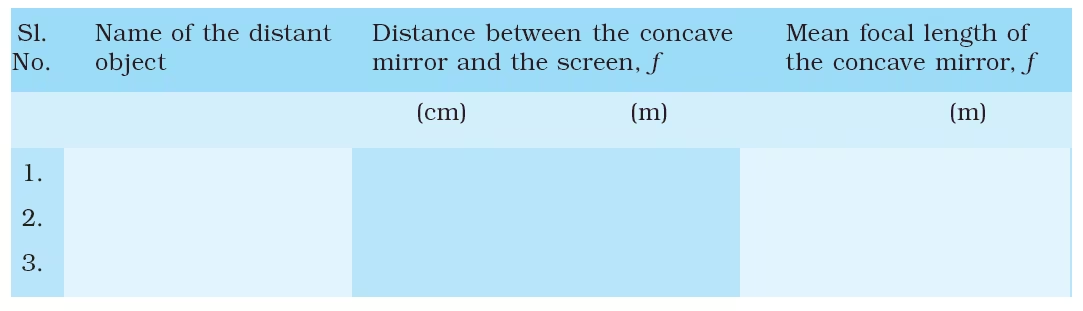
Results and Discussion
The approximate value of the focal length of the given concave mirror is ____ m.
Precautions
- The concave mirror should be placed near an open window through which sufficient sunlight enters, with its polished surface facing the distant object.
- There should be no obstacle in the path of rays of light from the distant object, incident on the concave mirror.
- The image of the sun should be focussed only on the screen. The image of the sun should never be seen directly by the naked eye. Sunlight should never be focussed with a concave mirror on any part of the body, paper or any inflammable materials, as it could be dangerous to do so.
- In order to obtain a sharp and clear image of the distant object on the wall/ground, it must be ensured that the object is well illuminated so that the amount of light incident on the concave mirror is sufficient to produce a well-illuminated and distinct image.
- The base of the stands of the concave mirror and screen should be parallel to the measuring scale. The mirror holder along with the mirror should be kept perpendicular to the measuring scale for precise measurements.
Note for the Teacher
- Use the concave mirror with a focal length preferably between 15 cm to 20 cm.
- A distant object does not necessarily mean a very far-off object, like a building, a tree or an electricity pole. A well-illuminated window or a glowing bulb at a distance of about 10 to 15 m away, even within the science laboratory, may also be taken as a distant object. Why?
Questions
- How will you distinguish between a concave and a convex mirror?
- To determine the focal length of a concave mirror, a student focuses on a classroom window, a distant tree and the sun on the screen with the help of a concave mirror. In which case will the student get a more accurate value of focal length?
- What will be the nature of an image formed by a concave mirror for a distant object?
- In reflector type solar cookers, special concave (parabolic) mirrors are used. In such cookers, what should be the preferable position of a food vessel for cooking?
6. To determine the focal length of a thin convex lens by obtaining an image of a distant object.
Aim: To determine the focal length of a thin convex lens by obtaining an image of a distant object.
Theory
The rays of light coming from a distant object such as the sun (or a distant tree or a distant building) can be considered to be parallel to each other. When a parallel beam of light falls on a convex lens, the rays, after refraction, converge at a point on its other side. This point is one of the two foci of the
.avif)
lens. If the parallel beam of light comes from a distant object, a real, inverted image of a very small size is formed at the focus of the lens [Fig. 44.1]. Since the image formed by the lens is real, it can be obtained on a screen. The distance between the optical centre O of the convex lens and the focus point F1 or F2 is its focal length. Thus, the focal length of a convex lens can be estimated by obtaining a real image of a distant object at its focus.
Materials Required
A thin convex lens, a lens holder, a small screen fixed to a stand, and a measuring scale.
Procedure
- Fix a thin convex lens on a lens holder and place it on the table or platform near an open window through which sufficient sunlight enters. Turn the face of the lens towards a distant object (a tree an electricity pole or a distant building).
- Place the screen fixed to a stand on the other side of the lens. Adjust the position of the screen (by moving it back and forth in front of the convex lens) to get a sharp, clear and inverted image of the distant object on it (Fig. 44.2). A clear and bright image could also be obtained
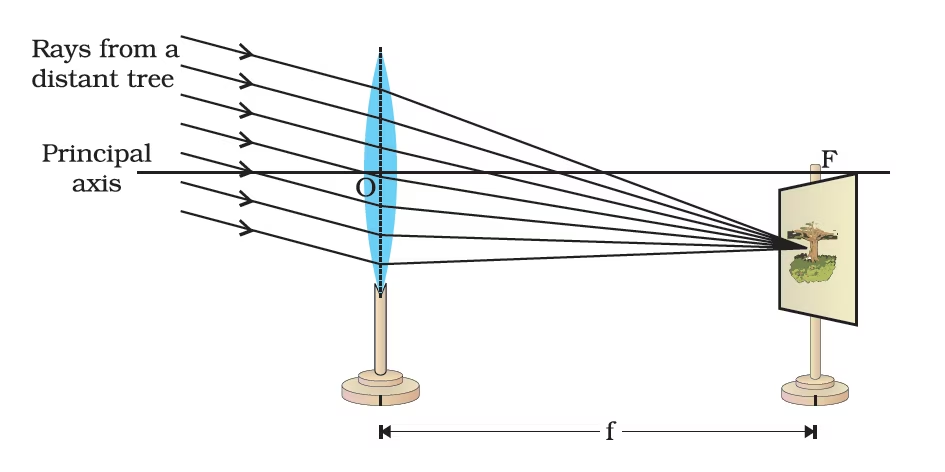
if the distant object, say a tree or a building, is illuminated with sunlight and the screen is kept in the shade. A bright image of the sun could also be obtained if the sunlight is made to fall directly on the lens.
- Mark the position of the centre of the stands holding the lens and that of the screen when a sharp image of the distant object has been obtained on the screen. Measure the horizontal distance between the centre of the convex lens and the screen with the help of a measuring scale. Record your observations in the observation table.
- Repeat the experiment two more times by obtaining the images of two different distant objects. Measure the distance between the convex lens and the screen in each case. Record them in the observation table.
- Find the average or mean value of the focal length.
Observations and Calculations
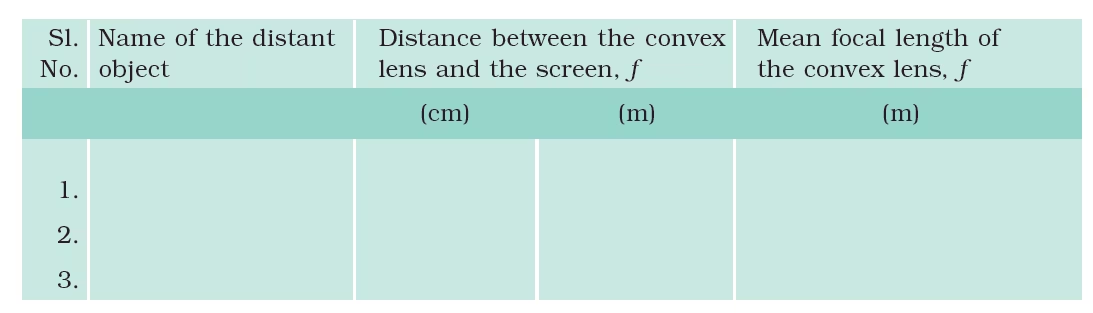
Results and Discussion
The approximate value of the focal length of the given convex lens is ____ m.
Precautions and Sources of Error
- The principal axis of the convex lens should be horizontal, that is, the lens should be placed vertically.
- There should be no obstacle in the path of rays of light from the distant object incident on the convex lens.
- The image of the sun formed by the lens should be focused only on the screen. The image of the sun should never be seen directly with the naked eye. Sunlight should never be focused with a convex lens on any part of the body, paper or any inflammable materials, as it can be dangerous to do so.
- Adjust the position of the convex lens such that the light rays coming from the distant object fall on the lens without any obstruction.
- To obtain a sharp and clear image of the distant object on the screen (or wall), it must be ensured that the distant object is well illuminated. This would allow an appreciable amount of light to fall on the lens. This is required to produce a well-illuminated and distinct image.
- In certain situations, the parallel rays of light originating from a distant object and incident on a convex lens may not be parallel to its principal axis as shown in Figs. 44.1(b) and 44.2. The image in such an event might be formed slightly away from the principal axis of the lens.
- The base of the stands of the convex lens and screen should be parallel to the measuring scale. To determine the focal length, the distance between the convex lens and the screen should be measured horizontally (placed at the focus point on the other side of the lens).
Note for the Teacher
- Use the thin convex lens with a focal length preferably between 15 cm to 20 cm.
- A distant object does not necessarily mean a very far-off object, like a building a tree or an electricity pole. A well-illuminated window or a glowing bulb at a distance of about 10 m to 15 m away, even within the science laboratory, may also be taken as a distant object.
Questions
- How will you distinguish between a convex and concave lens?
- To determine the focal length of a convex lens, a student focuses a classroom window, a distant tree and the sun on the screen. In which case will the student is closer to accurate value of focal length?
- What is the nature of an image formed by a thin convex lens for a distant object? What change do you expect if the lens were rather thick?
- You are provided with two convex lenses of the same aperure and different thickness. Which one of them will be of shorter focal length?
- If we cover one-half of the convex lens while focusing on a distant object, in what way will it affect the image formed?
CBSE Class 10 Science Lab Manual Syllabus
The Class 10 NCERT Science Lab Manual includes experiments in physics, chemistry, and biology, aligned with the CBSE syllabus. Here’s an overview of the key experiments for each subject:
List of Experiments
- Finding the pH of the following samples by using pH paper/universal indicator:
Dilute Hydrochloric Acid
Dilute NaOH solution
Dilute Ethanoic Acid solution
Lemon juice
Water
Dilute Hydrogen Carbonate solution
- Studying the properties of acids and bases (HCl & NaOH) based on their reaction with
Litmus solution (Blue/Red)
Zinc metal
Solid sodium carbonate
- Performing and observing the following reactions and classifying them into:
Combination reaction
Decomposition reaction
Displacement reaction
Double displacement reaction
- The action of water on quicklime
- The action of heat on ferrous sulphate crystals
- Iron nails kept in copper sulphate solution
- The reaction between sodium sulphate and barium chl
- Observing the action of Zn, Fe, Cu, and Al metals on the following salt solutions:
Unit-I
ZnSO4(aq)
FeSO4(aq)
CuSO4(aq)
Al2 (SO4)3(aq)
- Arranging Zn, Fe, Cu, and Al (metals) in the decreasing order of reactivity based on the above result.
- Studying the dependence of potential difference (V) across a resistor on the current (I) passing through it and determining its resistance. Also plotting a graph between V and I.
- Determination of the equivalent resistance of two resistors when connected in series and parallel.
- Preparing a temporary mount of a leaf peel to show stomata.
- Experimentally shows that carbon dioxide is given out during respiration.
- Study of the following properties of acetic acid (ethanoic acid):
Odour
solubility in water
Effect on litmus
Reaction with Sodium Hydrogen Carbonate
- Study of the comparative cleaning capacity of a sample of soap in soft and hard water.
- Determination of the focal length of:
Concave mirror
Convex lens by obtaining the image of a distant object.
- Tracing the path of a ray of light passing through a rectangular glass slab for different angles of incidence. Measure the angle of incidence, angle of refraction, and angle of emergence and interpret the result.
Unit - III
- Studying:
Binary fission in Amoeba,
Budding in yeast and Hydra with the help of prepared slides.
- Tracing the path of the rays of light through a glass prism.
- Identification of the different parts of an embryo of a dicot seed (Pea, gram or red kidney bean).
Practical Marks Breakdown
Your performance in science practicals is important, as it counts towards the final result. Here’s how the marks are typically distributed:
- Experimentation (5 Marks): Perform the assigned experiments, and you’ll be evaluated on accuracy, technique, and how well you document your observations.
- Lab Record (5 Marks): Maintain a well-organised lab manual. It should include details for each experiment, such as the aim, procedure, observations, and conclusions.
- Viva Voce (5 marks): Answer questions related to the experiments you conducted. This tests your understanding of both the experiments and the concepts behind them.
- Project Work (5 Marks): You may need to submit a project, which will be checked on creativity, understanding, and how well you’ve documented the process.
What Makes a Perfect Class 10 Science Practical File?
The Science practical file is a important component of your Class 10 Science assessment. It is not just a record of your experiments but also a reflection of your understanding, creativity, and dedication. Here, we highlight the important features that your Science practical file should include to make it stand out.
Key Features of a Class 10 Science Practical File
- Well-Structured Index- A neatly organized index listing all the experiments with page numbers makes sure of easy navigation.
- Detailed Experiments- Each experiment should have a clear structure, including:
- Aim: The purpose of the experiment
- Materials Required: A list of items used
- Procedure: Step-by-step instructions
- Observations: Data recorded during the experiment
- Conclusion: Final findings
- Accurate Diagrams- Include neat, labeled diagrams wherever applicable to enhance clarity and visual appeal.
- Comprehensive Viva Preparation- Add commonly asked viva questions and their answers related to each experiment.
- Observation Tables- Maintain detailed and accurate observation tables for numerical or measurable experiments.
- Graphical Representation- If applicable, represent data using graphs or charts for better presentation and understanding.
- Neat and Clean Presentation- Make sure the file is tidy, with no smudges or overwriting. Use proper headings and subheadings.
- Teacher's Signature- Get your practical file regularly checked and signed by your teacher for authenticity.
Why Is This Important?
A well-made practical file not only helps in securing marks but also improves your conceptual understanding. It reflects your sincerity and preparation level during viva voce and practical exams.
Project Idea- Video 1
Project Idea- Video 2
Project Idea- Video 3
Project Idea- Video 4
Tips and Tricks for Excelling in Science Practicals
Practical exams can be challenging, but these tips will help you stay prepared and perform well:
- Review each experiment carefully before the exam. Practice where possible to avoid mistakes during the practical.
- Make sure your lab manual is up-to-date and neatly written. Clear, well-maintained records can make a positive impression on your examiner.
- Don’t just memorise the steps of an experiment—ensure you fully understand the science behind it. This will help you answer viva questions more confidently.
- Diagrams are often required for certain experiments. Practice drawing neat, well-labelled diagrams for a better score.
- Anxiety can lead to mistakes. Stay calm, follow the steps carefully, and focus on doing your best.
- Regular revision of science concepts related to the experiments will reinforce your understanding and help you perform well.
- Practice proper lab techniques, like accurate measurement and safe handling of chemicals, to ensure precision and safety.

The Lab Manual Science Class 10th is an excellent resource for students to strengthen their familiarisation of science concepts through practical application. By fully understanding and engaging in the experiments, keeping a well-maintained lab manual, and staying organised, you’ll not only do well in your practical exams but also enhance your overall understanding of science.


