Question:
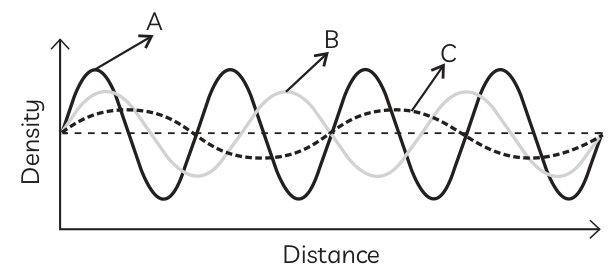
The sound waves emitted by three sources A, B and C are represented in the given figure. If the frequency of A is maximum and C is minimum, identify the corresponding curves, and mark A, B and C on them.
Answer:
Verified
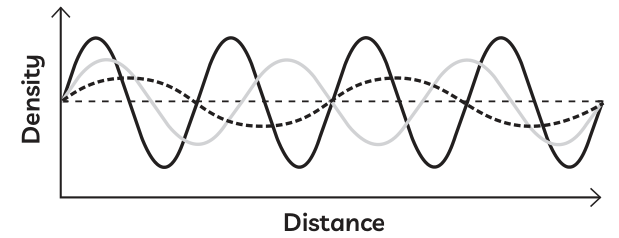
Frequency depends on the number of oscillations produced in a given time. The wave with more oscillations has higher frequency, while the wave with fewer oscillations has lower frequency.
• The thick curve line has the maximum number of oscillations, so it represents A (maximum frequency).
• The dotted curve has the minimum number of oscillations, so it represents C (minimum frequency).
• The thin curve line represents B.