
Question:
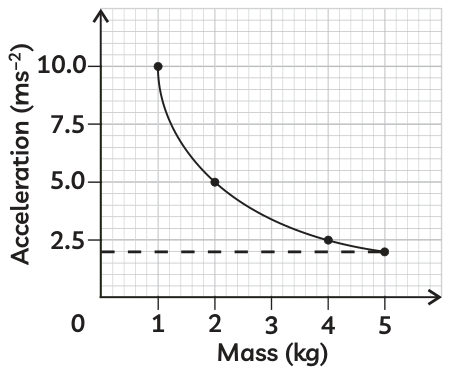
The acceleration-mass graph for the acceleration produced by a force on objects of different masses is plotted in the given figure. Plot the force-mass graph for this case.
Answer:
Verified
To plot the force-mass graph, we calculate for each mass using values from the given graph:
| Mass (kg) | Acceleration (m/s2) | Force = (N) |
|---|---|---|
| 1 | 10 | 10 |
| 2 | 5 | 10 |
| 3 | 3.3 | 10 |
| 4 | 2.5 | 10 |
| 5 | 2 | 10 |
The force comes out to be 10 N in every case.
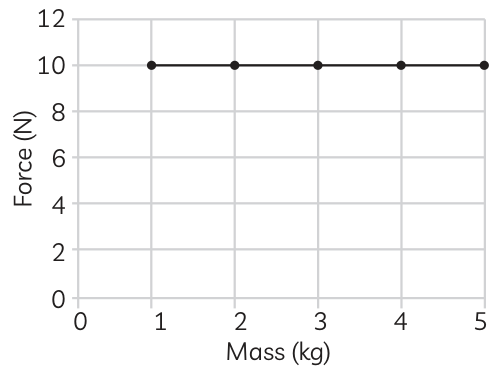
The force-mass graph is a horizontal straight line at N, parallel to the mass-axis. This shows that the same constant force of 10 N was applied to all objects, and the acceleration is decreased only because the mass is increased.