Question:
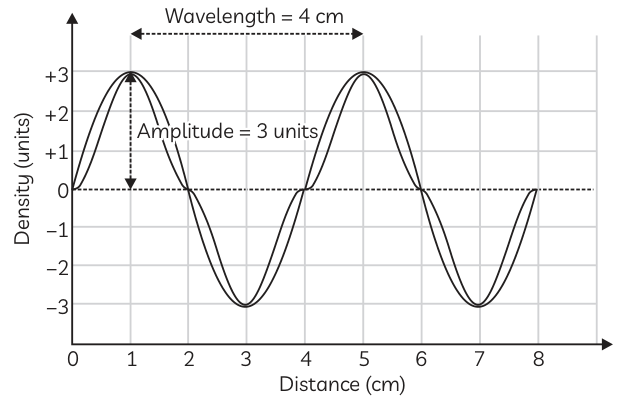
Draw a graph to represent a sound wave for which the density amplitude is 3 units and wavelength is 4 cm.
Answer:
Verified
To draw a graph of a sound wave with the given parameters, the distance is plotted on the x-axis (in cm) and the density is plotted on the y-axis (in units). The amplitude is the maximum height of the crest (or depth of the trough) from the average density line, which is 3 units here. The wavelength is the distance between two consecutive crests or troughs, which is 4 cm.