
Two cars A and B start moving with a constant acceleration from rest, in a straight line. Car A attains a velocity of 5 m s⁻¹ in 5 s. Car B attains a velocity of 3 m s⁻¹ in 10 s.
Plot the velocity-time graphs for both the cars in the same graph. Using the graph, calculate the displacement in the two time intervals mentioned (Hint: Calculate the acceleration in both cases. Then calculate their velocities at five instants of time to plot the graph).
For car A:
Acceleration of car A,
For car B:
Acceleration of car B,
To plot the velocity-time graph:
(1) Draw time on the X-axis and velocity on the Y-axis.
(2) For car A, join the points (0, 0) and (5, 5).
(3) For car B, join the points (0, 0) and (10, 3).
Therefore, the displacement of car A is 12.5 m and the displacement of car B is 15 m.
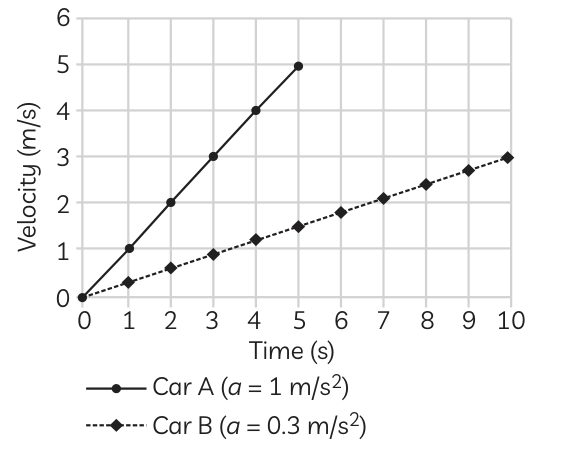
The displacement is equal to the area under the velocity-time graph.
For car A:
For car B: