
The velocity-time graph from 0 s to 120 s for a cyclist is shown in the given figure.
Shade the areas (in different colours) representing the displacement of the cyclist:
(A) while cyclist is moving with constant velocity.
(B) when the velocity of cyclist is decreasing. Also, calculate the displacement and average acceleration in the 120 s time interval.
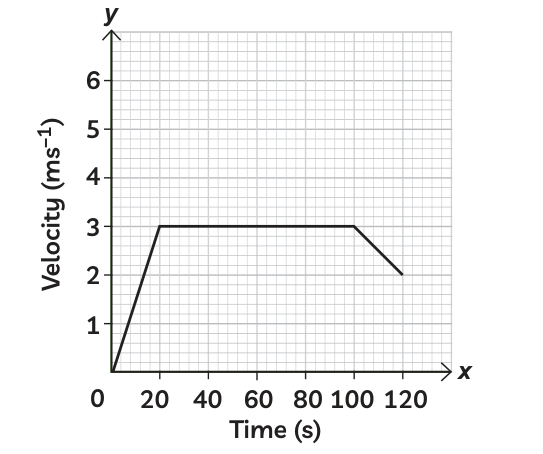
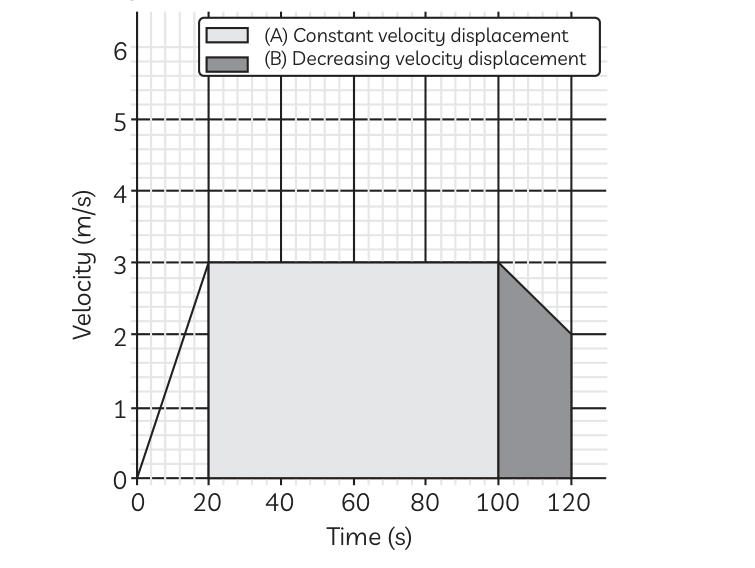
(A) In the given velocity-time graph, shade the rectangular area under the graph from 20 s to 100 s in one colour. This area represents the displacement while the cyclist is moving with constant velocity.
(B) Shade the trapezium-shaped area under the graph from 100 s to 120 s in another colour. This area represents the displacement while the cyclist is moving with decreasing velocity.
The displacement of the cyclist is equal to the total area under the velocity-time graph.
Now,
The displacement of the cyclist is 320 m and the average acceleration is 0.017 ms.